Stock Market Outlook for February 4, 2026

Staying engaged in stocks, but increasingly risk-aware heading into normal February volatility.
*** Stocks highlighted are for information purposes only and should not be considered as advice to purchase or to sell mentioned securities. As always, the use of technical and fundamental analysis is encouraged in order to fine tune entry and exit points to average seasonal trends.
Stocks Entering Period of Seasonal Strength Today:
Subscribers Click on the relevant link to view the full profile. Not a subscriber? Signup here.

Alamos Gold Inc. (TSE:AGI.TO) Seasonal Chart

Euro Sun Mining Inc. (TSE:ESM.TO) Seasonal Chart

iShares Core High Dividend ETF (NYSE:HDV) Seasonal Chart

Yum China Holdings, Inc. (NYSE:YUMC) Seasonal Chart
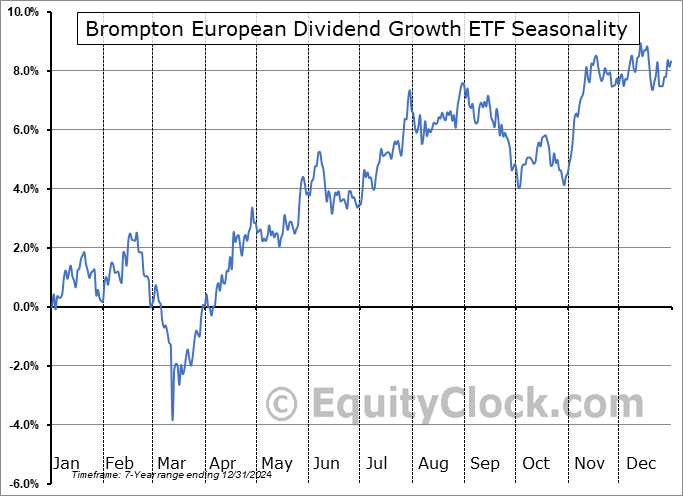
Brompton European Dividend Growth ETF (TSE:EDGF.TO) Seasonal Chart
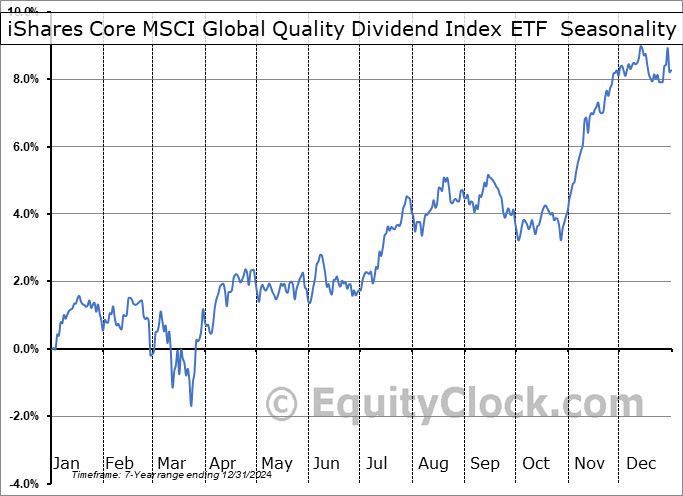
iShares Core MSCI Global Quality Dividend Index ETF (TSE:XDG.TO) Seasonal Chart
Disclaimer: Comments and opinions offered in this report are for information only. They should not be considered as advice to purchase or to sell mentioned securities. Data offered is believed to be accurate, but is not guaranteed.
The Markets
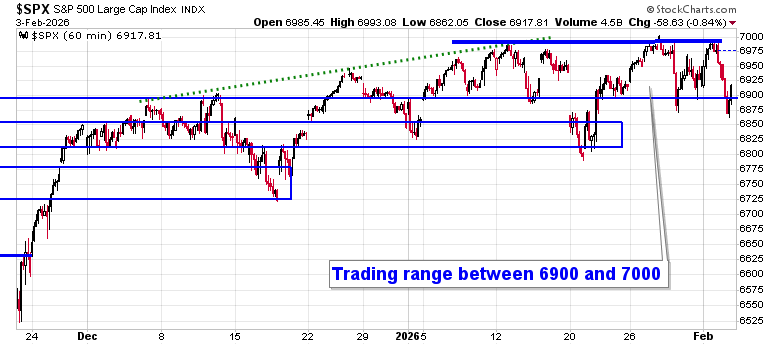
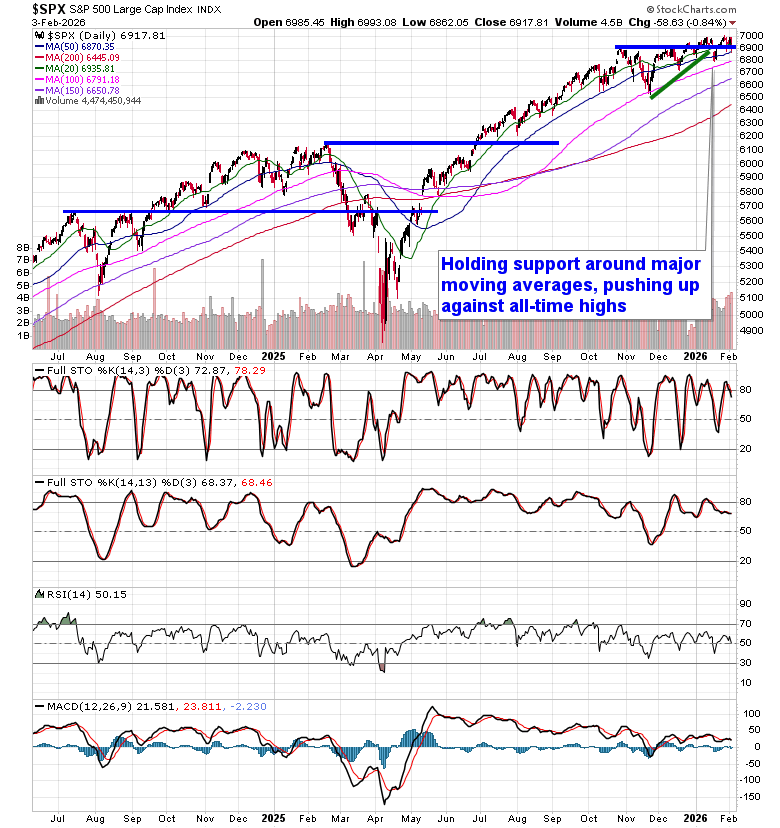
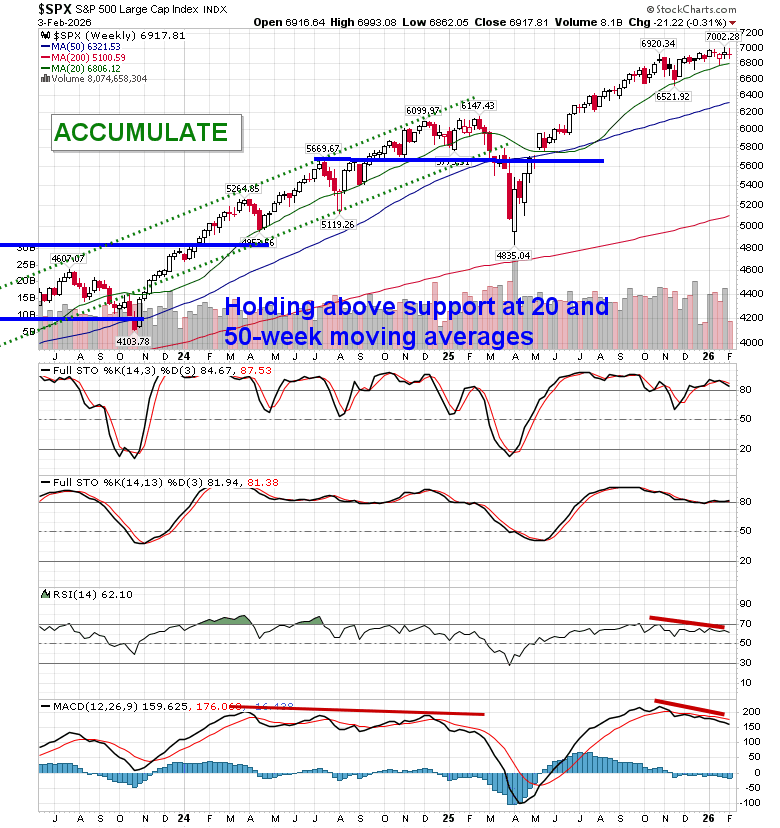
Stocks came under pressure on Tuesday as ongoing selling pressures in Bitcoin and rotation out of technology took a toll on broad market benchmarks. The S&P 500 Index closed lower by just over eight-tenths of one percent, intersecting with short-term support around 6900 at the lows of the session. A trading range between this and the all-time peak around 7000 remains intact. While these gyrations from the highs to the lows of the horizontal span can easily give reason to flip-flop on the overall market stance, the pattern that has been carved out since the year began still gives the edge to an upside resolution. Previous October gap resistance turned support around 6830 has been keeping us engaged with equity exposure until definitively broken. We remain on the lookout for a potential shift of the market’s character ahead where levels of resistance hold greater weight than support and, while the very recent price action has provided hints of this, nothing definitive has been revealed yet to shake us loose of our equity exposure; should a topping pattern become confirmed, looking to trim equity exposure will become prudent, bracing for the kind of volatility that is average around this time of year. In the Seasonal Advantage Portfolio that we manage for clients at CastleMoore, there have been no trades that have been considered to be required and we continue to benefit from our pro-cyclical and commodity oriented stance (many of which were positive last week, overall). We continue to tailor towards the themes in our chart books to either Accumulate or Avoid that have been capturing the strength and rotation that has filtered into the market from the November 20th lows.
Today, in our Market Outlook to subscribers, we discuss the following:
- Market Action & Technical Backdrop
- Portfolio Positioning & Strategy
- Defensive Rotation Is Gaining Traction
- Consumer Staples & Utilities Leadership
- Risk Sentiment: Staples vs. Discretionary
- Waste & Environmental Services: Quiet Defensive Winners
- Value Continues to Dominate Growth
Subscribers can look for this report in their inbox or by clicking on the following link and logging in: Market Outlook for February 4
Not signed up yet? Subscribe now to receive full access to all of the research and analysis that we publish
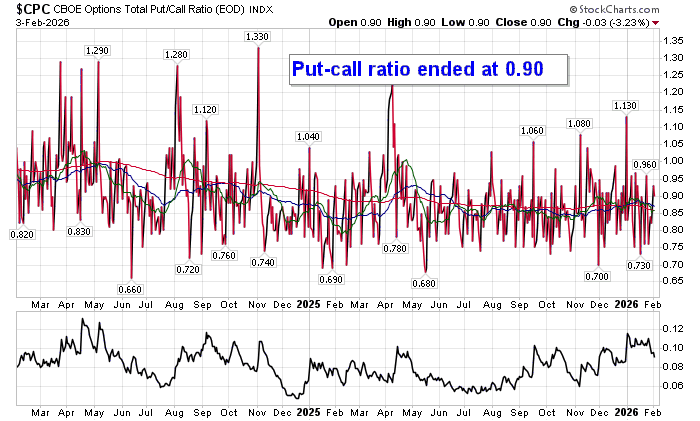
Sentiment on Tuesday, as gauged by the put-call ratio, ended slightly bullish at 0.90.
Seasonal charts of companies reporting earnings today:


S&P 500 Index
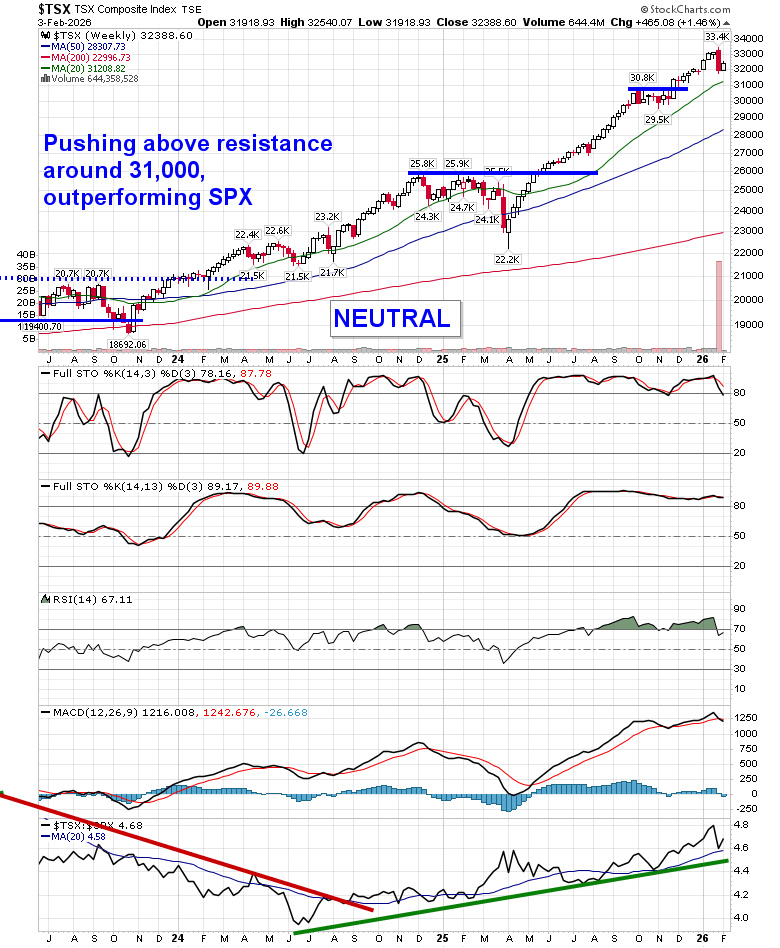
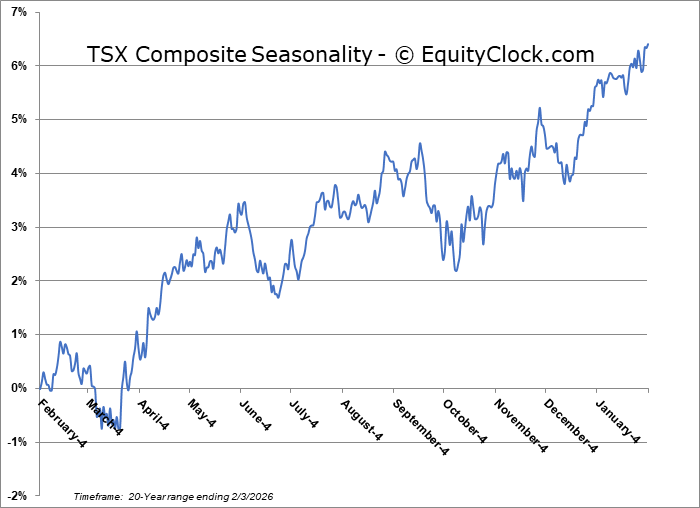
TSE Composite
| Sponsored By... |

|


