Stock Market Outlook for February 6, 2026

The market is de-risking…and so are we.
*** Stocks highlighted are for information purposes only and should not be considered as advice to purchase or to sell mentioned securities. As always, the use of technical and fundamental analysis is encouraged in order to fine tune entry and exit points to average seasonal trends.
Stocks Entering Period of Seasonal Strength Today:
Subscribers Click on the relevant link to view the full profile. Not a subscriber? Signup here.

SPDR Russell 1000 Low Volatility Focus ETF (AMEX:ONEV) Seasonal Chart

CI WisdomTree International Qlty Divi Growth Index ETF (TSE:IQD.TO) Seasonal Chart

Tekla Healthcare Opportunies Fund (NYSE:THQ) Seasonal Chart

Invesco DWA Consumer Staples Momentum ETF (NASD:PSL) Seasonal Chart

Archer Daniels Midland Co. (NYSE:ADM) Seasonal Chart
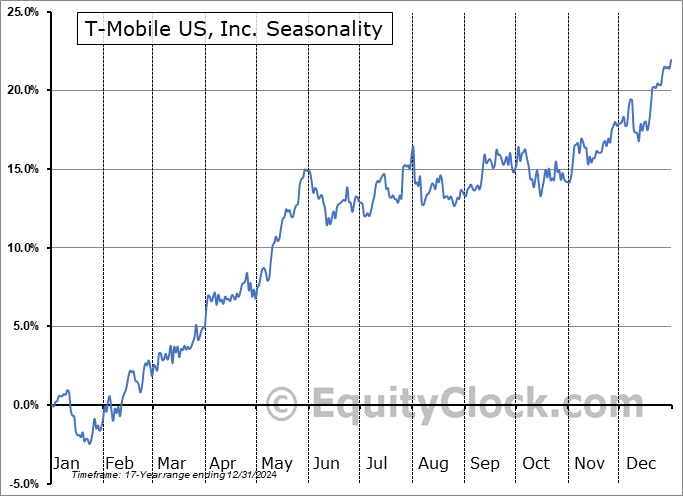
T-Mobile US, Inc. (NASD:TMUS) Seasonal Chart

Scorpio Tankers Inc. (NYSE:STNG) Seasonal Chart

Mine Safety Appliances Co. (NYSE:MSA) Seasonal Chart

Dollar Tree, Inc. (NASD:DLTR) Seasonal Chart

McDonalds Corp. (NYSE:MCD) Seasonal Chart
Disclaimer: Comments and opinions offered in this report are for information only. They should not be considered as advice to purchase or to sell mentioned securities. Data offered is believed to be accurate, but is not guaranteed.
The Markets
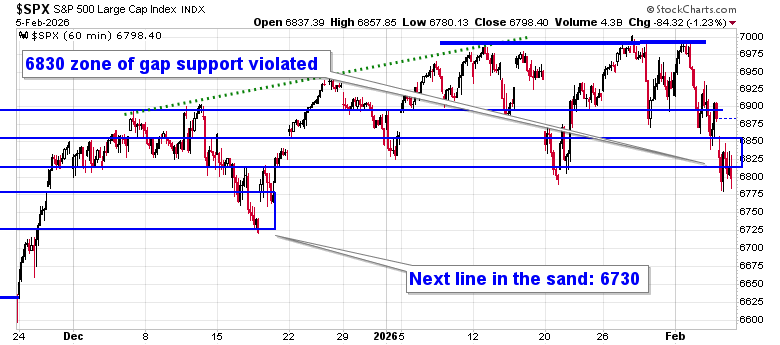
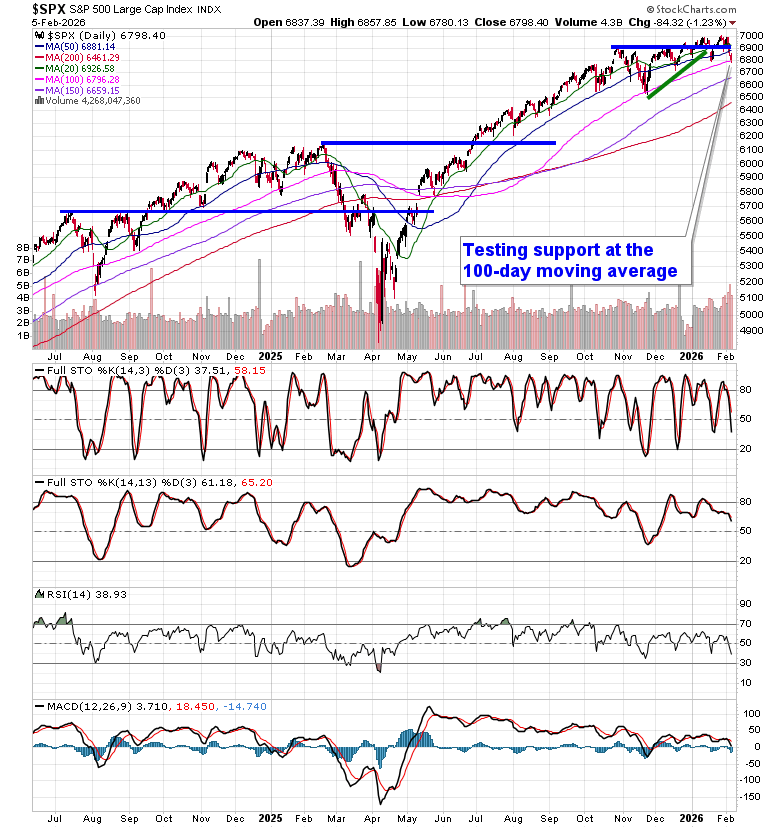
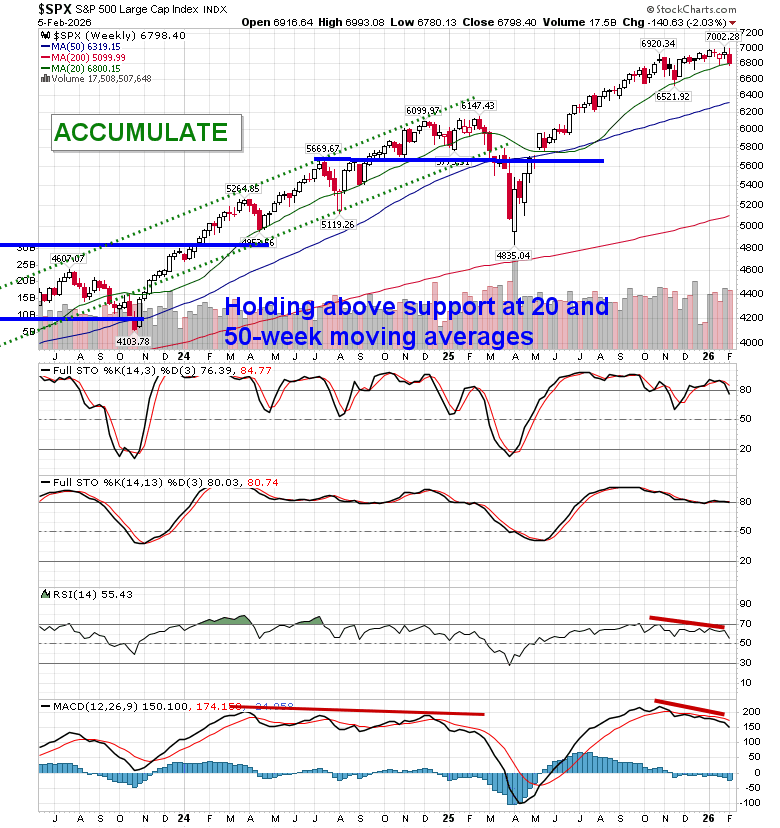
Selling pressures continued into the Thursday session as the cryptocurrency market reached new multi-month lows, even as precious metals (which many had argued as capturing the flows from the digital assets) sold off hard themselves. The S&P 500 Index closed down by 1.23%, moving definitively below recent support at 6900 and violating the 6830 line in the sand that we had presented as the point where elevated equity exposure should be questioned. The latter threshold represented the zone of October gap resistance turned support and, while the benchmark spent some time in the span on Thursday, it ultimately failed to attract buying demand. Below this zone, the point of support to now scrutinize on the downside it 6730, or the mid-December lows. The appearance of a double-top pattern and the loss of the aforementioned levels of support highlights the shift of character of the market that we had been growing cautious of where levels of support matter less than levels of resistance. Looking to trim equity exposure in this backdrop, until resolved, has become prudent, bracing for the kind of volatility that is average around this time of year. In the Seasonal Advantage Portfolio that we manage for clients at CastleMoore, we took action on Thursday to align with the risks that are creeping into the market ahead of the average mid-February peak in stocks, but, we have not been enticed, yet, to abandon our pro-cyclical and commodity oriented stance that has been flourishing this year. Themes in our chart books to either Accumulate or Avoid continue to gear towards the trends that are working and intact, but we will be scrutinizing the weekly charts closely to determine if any changes in some of our favourable views are required.
Today, in our Market Outlook to subscribers, we discuss the following:
- Market Breakdown & Shift in Character
- Portfolio Actions & Risk Reduction
- Defensive Rotation Confirmed
- Super Simple Seasonal Portfolio Adjustments
- Economic Signals: Manufacturing vs. Consumer
- Heavy Truck Sales Signal Manufacturing Rebirth
- Autos: Seasonal & Consumer Headwinds
- Labor Market: Early Cracks, Not Yet Alarming
- Growth Sectors Under Pressure
Subscribers can look for this report in their inbox or by clicking on the following link and logging in: Market Outlook for February 6
Not signed up yet? Subscribe now to receive full access to all of the research and analysis that we publish
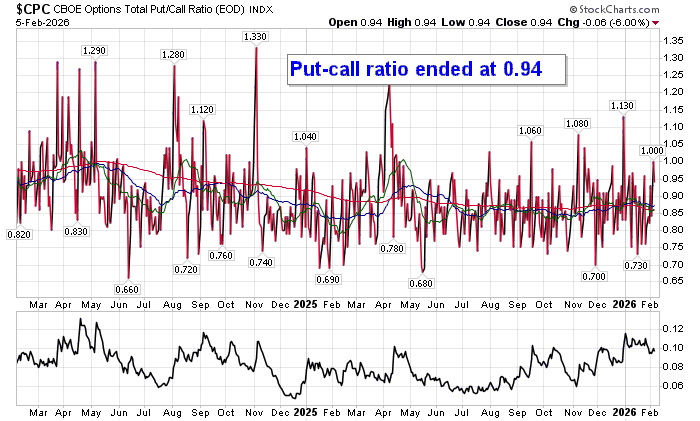
Sentiment on Thursday, as gauged by the put-call ratio, ended slightly bullish at 0.94.
Seasonal charts of companies reporting earnings today:


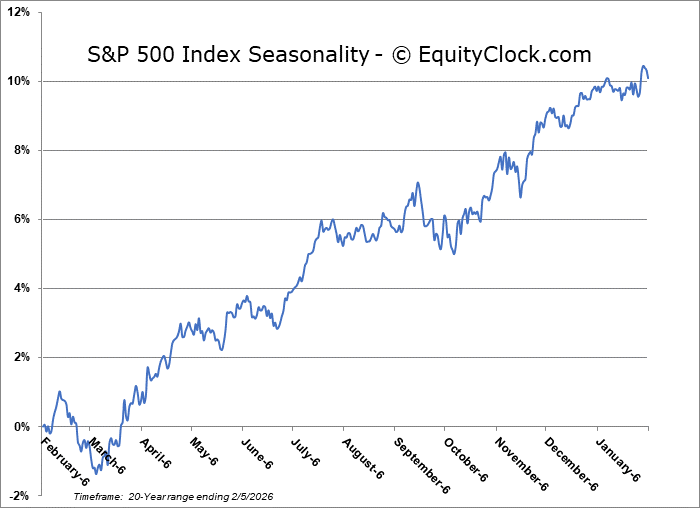
S&P 500 Index
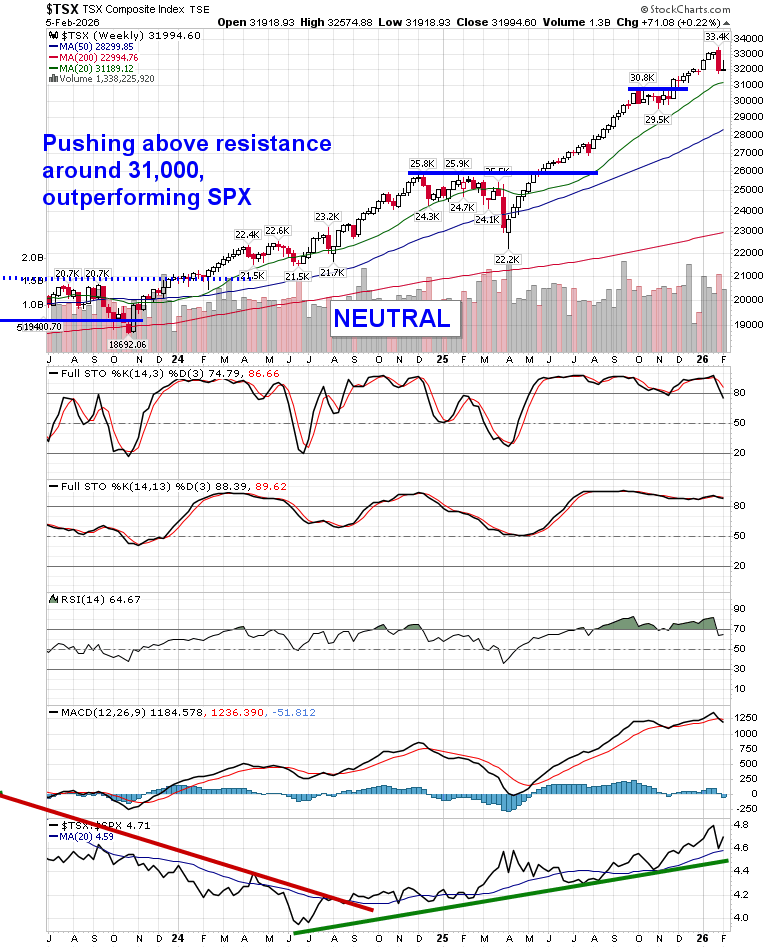
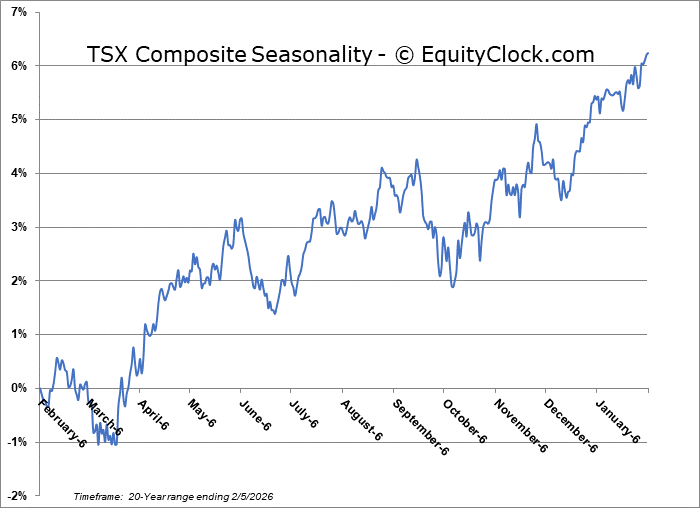
TSE Composite
| Sponsored By... |

|


