Stock Market Outlook for February 10, 2026

Late-February Volatility on the Horizon —Here’s How We’re Positioning
*** Stocks highlighted are for information purposes only and should not be considered as advice to purchase or to sell mentioned securities. As always, the use of technical and fundamental analysis is encouraged in order to fine tune entry and exit points to average seasonal trends.
Stocks Entering Period of Seasonal Strength Today:
Subscribers Click on the relevant link to view the full profile. Not a subscriber? Signup here.

Vanguard Total World Stock ETF (NYSE:VT) Seasonal Chart

Invesco Global Water ETF (NASD:PIO) Seasonal Chart

iShares International Developed Real Estate ETF (NASD:IFGL) Seasonal Chart

iShares Currency Hedged MSCI EAFE ETF (AMEX:HEFA) Seasonal Chart

Teekay Tankers Ltd. (NYSE:TNK) Seasonal Chart

iShares MSCI ACWI ex US ETF (NASD:ACWX) Seasonal Chart

Genco Shipping & Trading Ltd. (NYSE:GNK) Seasonal Chart

Teekay Corp. (NYSE:TK) Seasonal Chart

Clean Harbors, Inc. (NYSE:CLH) Seasonal Chart

iShares MSCI EAFE ETF (NYSE:EFA) Seasonal Chart
Disclaimer: Comments and opinions offered in this report are for information only. They should not be considered as advice to purchase or to sell mentioned securities. Data offered is believed to be accurate, but is not guaranteed.
The Markets
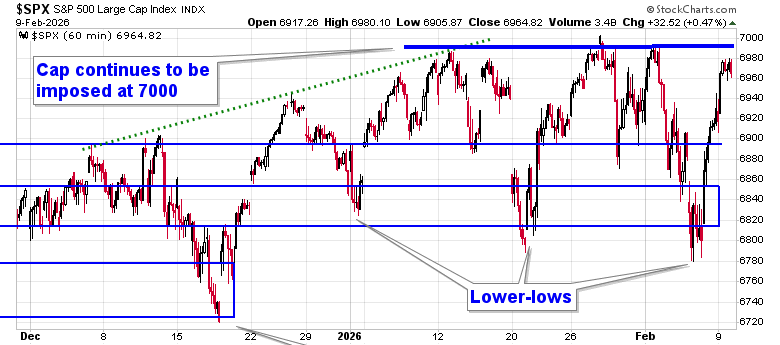
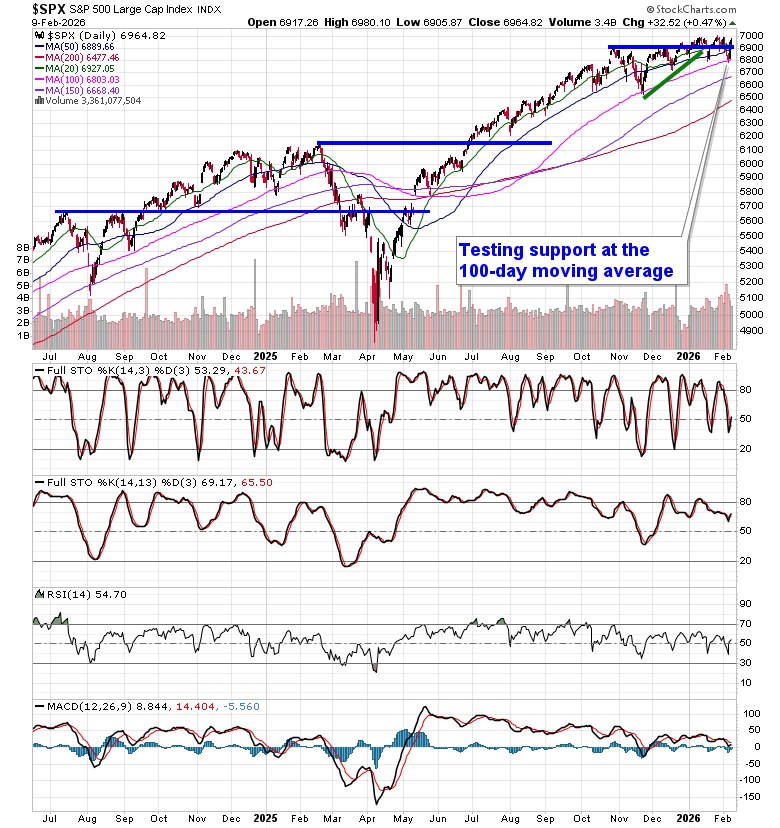
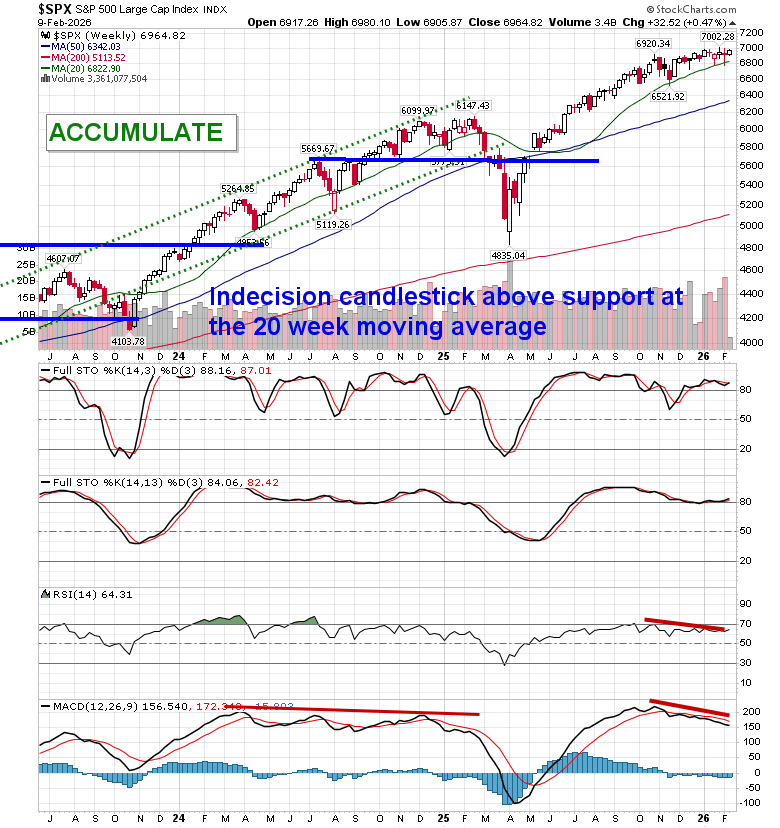
Stocks stabilized from last week’s technology/crypto fuelled selloff to close higher in the first session of the new week as market participants await some key economic data points through the days ahead (eg. Non-Farm Payrolls, Consumer Price Index). The S&P 500 Index added just less than half of one percent, reaching back towards the cap that has been imposed on the benchmark for the past few weeks around 7,000. A slight negative skew remains with highs fixed around aforementioned resistance and lower-lows recorded since the year began. Nothing extreme has developed, yet, and the benchmark remains within arm’s reach of the all-time high charted less than two weeks ago. Threats remain for a downside resolution to 6730, or the mid-December lows, particularly through the period of seasonal weakness for stocks that is average later in February. The character of the market seems to have shifted where levels of resistance (at least on this tech heavy benchmark) are holding greater weight than levels of support. Looking to trim equity exposure in this backdrop, until resolved, has become prudent, pulling back the elevated levels of exposure that were held through the Santa Claus rally period and into the first month of the year, bracing for the kind of volatility that is average later in February. In the Seasonal Advantage Portfolio that we manage for clients at CastleMoore, we have taken action to align with the risks that are creeping into the market ahead of the average mid-February peak in stocks, but, we have not been enticed, yet, to abandon our pro-cyclical and commodity oriented stance that has been flourishing this year. Themes in our chart books to either Accumulate or Avoid continue to gear towards the trends that are working and intact.
Want to know which areas of the market to buy or sell? Our Weekly Chart Books have just been updated, providing a clear Accumulate, Avoid, or Neutral rating for currencies, cryptocurrencies, commodities, broad markets, and subsectors/industries of the market. Subscribers can login and click on the relevant links to access.
- Currencies
- Cryptocurrencies
- Commodities
- Major Benchmarks
- Sub-sectors / Industries
- ETFs: Bonds | Commodities | Equity Markets | Industries | Sectors
Subscribe now.
Today, in our Market Outlook to subscribers, we discuss the following:
- Market Backdrop
- Rotation & Leadership
- Macro Watchpoints
- Technical & Cycle Considerations
- Portfolio Positioning: Our list of all segments of the market to either Accumulate or Avoid
- Downgrades & Avoids
- Other Notes
Subscribers can look for this report in their inbox or by clicking on the following link and logging in: Market Outlook for February 10
Not signed up yet? Subscribe now to receive full access to all of the research and analysis that we publish
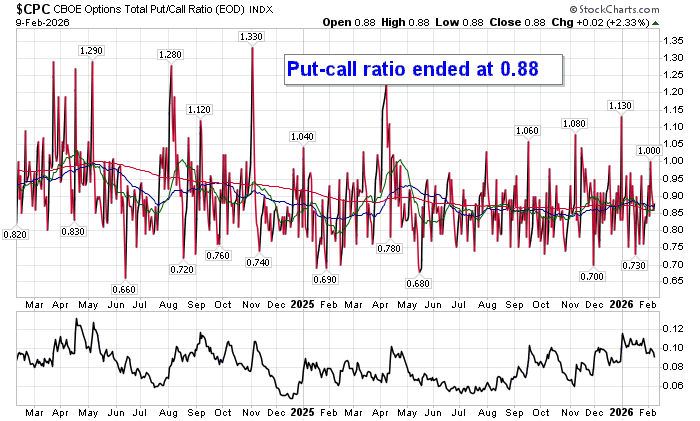
Sentiment on Monday, as gauged by the put-call ratio, ended bullish at 0.81.
Seasonal charts of companies reporting earnings today:


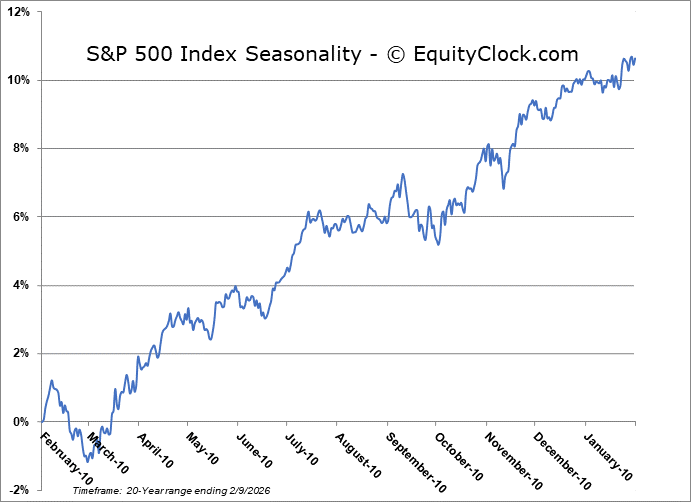
S&P 500 Index
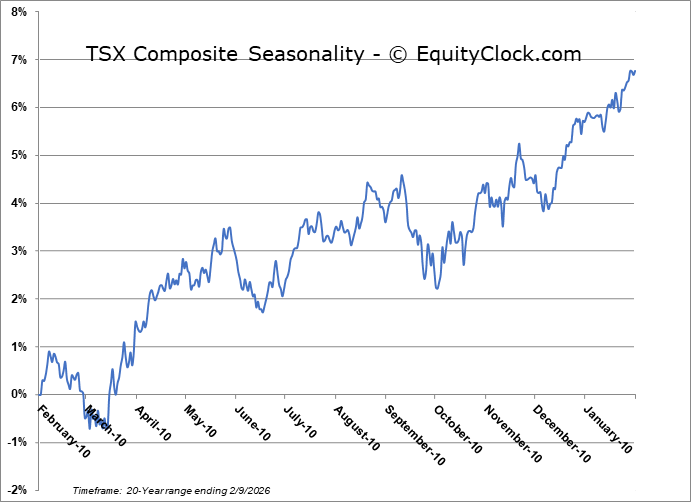
TSE Composite

| Sponsored By... |

|


