Stock Market Outlook for February 24, 2026

Stocks Slammed at Resistance as Money Rotates Defensive
*** Stocks highlighted are for information purposes only and should not be considered as advice to purchase or to sell mentioned securities. As always, the use of technical and fundamental analysis is encouraged in order to fine tune entry and exit points to average seasonal trends.
Stocks Entering Period of Seasonal Strength Today:
Subscribers Click on the relevant link to view the full profile. Not a subscriber? Signup here.

Pacer Trendpilot European Index ETF (AMEX:PTEU) Seasonal Chart

SPDR STOXX Europe 50 ETF (NYSE:SPEU) Seasonal Chart

iShares Core MSCI Europe ETF (AMEX:IEUR) Seasonal Chart

ProShares MSCI EAFE Dividend Growers ETF (NYSE:EFAD) Seasonal Chart

Brookfield Renewable Corporation (NYSE:BEPC) Seasonal Chart

SBA Communications Corp. (NASD:SBAC) Seasonal Chart

Diana Shipping Inc. (NYSE:DSX) Seasonal Chart
Disclaimer: Comments and opinions offered in this report are for information only. They should not be considered as advice to purchase or to sell mentioned securities. Data offered is believed to be accurate, but is not guaranteed.
The Markets
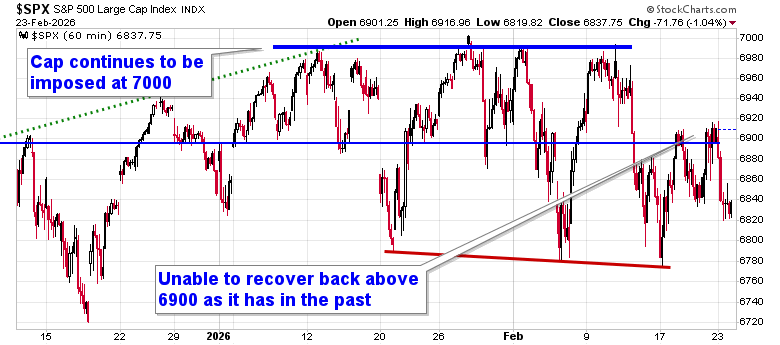
Stocks dropped on Monday as an escalation of tariff uncertainty following Friday’s Supreme Court ruling striking down the import tax had traders trimming risk. The S&P 500 Index fell by over one percent, starting to derive resistance at the 20-day moving average (~6908). Another denial from levels around horizontal resistance at 6900 increases the likelihood that we see a downside resolution to our target of 6730, or the mid-December lows. The benchmark has been swinging around the aforementioned horizontal hurdle for the past couple of months, each time finding the ability to snap back above the threshold. The price action over the past week and a half emphasizes a shift, one where levels of resistance are holding greater weight than support. Looking to trim equity exposure in this backdrop, until resolved, has become prudent, pulling back the elevated levels of exposure that were held through the Santa Claus rally period and into the first month of the year, bracing for the kind of volatility that is average at this time of year. In the Seasonal Advantage Portfolio that we manage for clients at CastleMoore, we have taken action to align with the risks that were creeping into the market ahead of this average mid-February peak in stocks, but, we have not been enticed, yet, to abandon our pro-cyclical and commodity oriented stance that has been flourishing this year. Themes in our chart books to either Accumulate or Avoid continue to gear towards the trends that are working and intact.
Want to know which areas of the market to buy or sell? Our Weekly Chart Books have just been updated, providing a clear Accumulate, Avoid, or Neutral rating for currencies, cryptocurrencies, commodities, broad markets, and subsectors/industries of the market. Subscribers can login and click on the relevant links to access.
- Currencies
- Cryptocurrencies
- Commodities
- Major Benchmarks
- Sub-sectors / Industries
- ETFs: Bonds | Commodities | Equity Markets | Industries | Sectors
Subscribe now.
Today, in our Market Outlook to subscribers, we discuss the following:
- Market Setup: Resistance Gaining Control
- Seasonal & Technical Risk Window
- Clear Rotation Into Defense
- Silver
- Consumer Staples
- Auto Parts
- Our list of market segments to Accumulate or Avoid
- Other Notes
- Big Picture Themes
Subscribers can look for this report in their inbox or by clicking on the following link and logging in: Market Outlook for February 24
Not signed up yet? Subscribe now to receive full access to all of the research and analysis that we publish
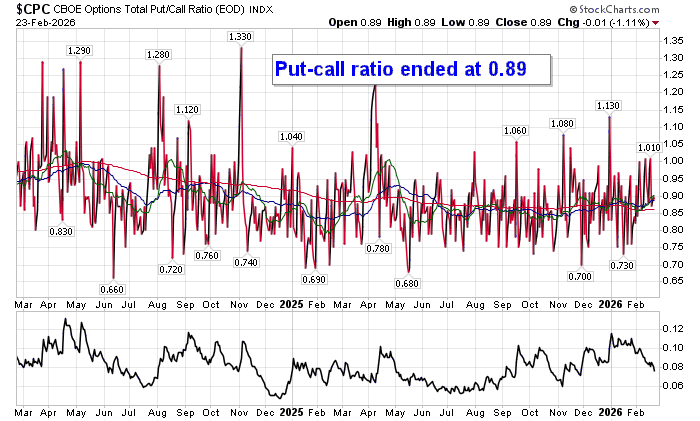
Sentiment on Monday, as gauged by the put-call ratio, ended slightly bullish at 0.89.
Seasonal charts of companies reporting earnings today:


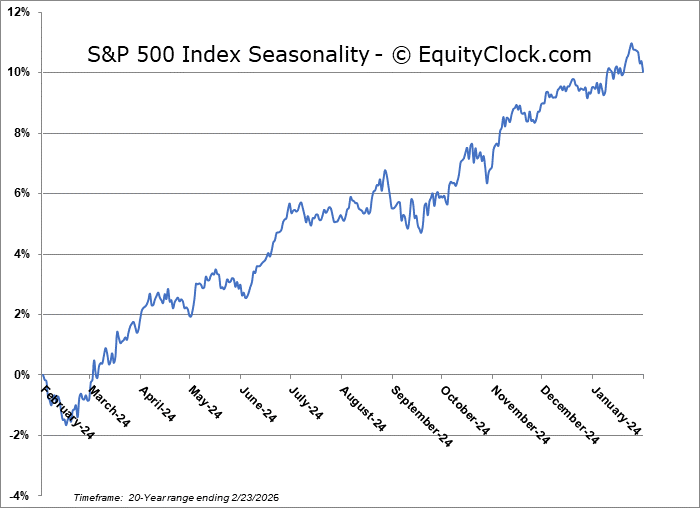
S&P 500 Index
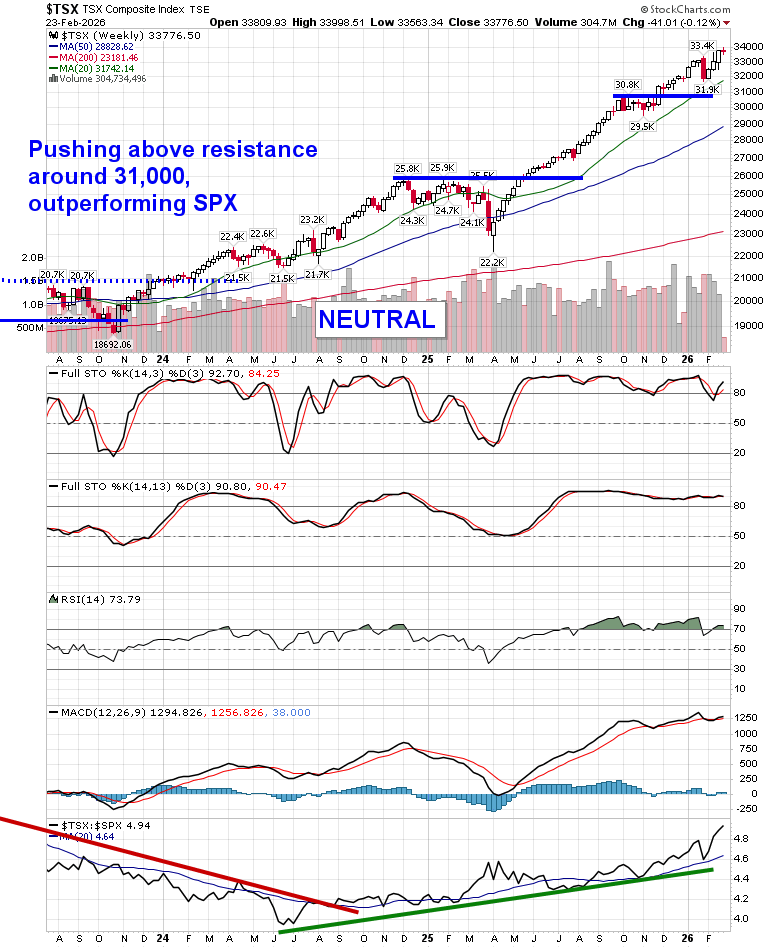
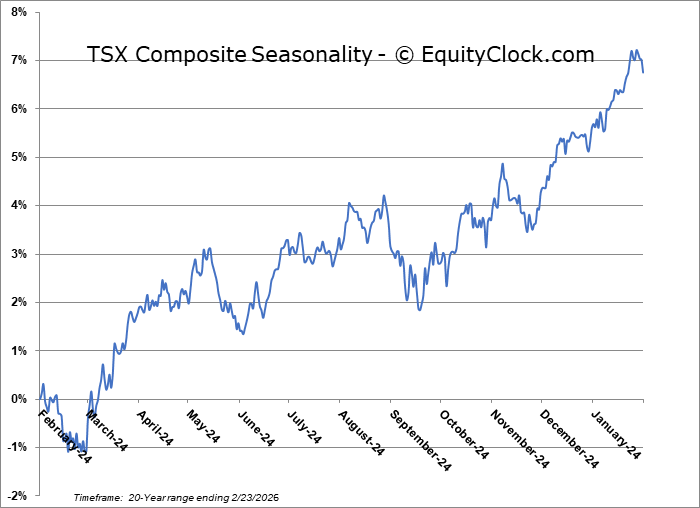
TSE Composite
| Sponsored By... |

|


