Stock Market Outlook for March 25, 2026

No derailment in the economy to suggest detouring from seasonal norms in pro-cyclical plays.
*** Stocks highlighted are for information purposes only and should not be considered as advice to purchase or to sell mentioned securities. As always, the use of technical and fundamental analysis is encouraged in order to fine tune entry and exit points to average seasonal trends.
Stocks Entering Period of Seasonal Strength Today:
Subscribers Click on the relevant link to view the full profile. Not a subscriber? Signup here.
Stock Highlight: |
|

McKesson Corp. (NYSE:MCK) Seasonal Chart |
|

Resmed, Inc. (NYSE:RMD) Seasonal Chart
Editors note: In an effort to make the “Stocks Entering Period of Seasonal Strength” section more insightful, each day we will be highlighting one of the stocks with the most enticing attributes to consider buying for its optimal holding period. Brief comments will be provided beside the seasonal chart and subscribers can click on the graph to access the entire seasonal profile of the security being highlighted.
Disclaimer: Comments and opinions offered in this report are for information only. They should not be considered as advice to purchase or to sell mentioned securities. Data offered is believed to be accurate, but is not guaranteed.
The Markets
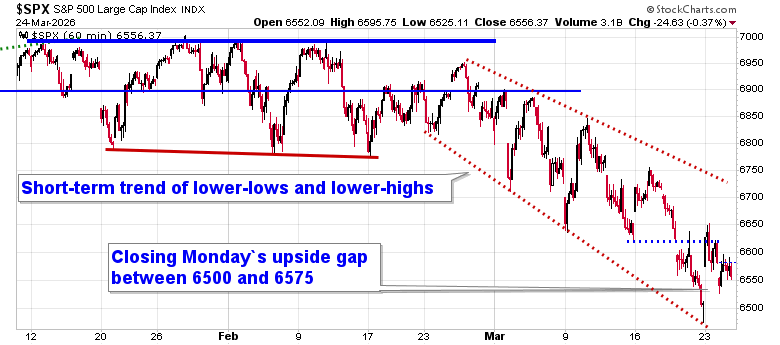
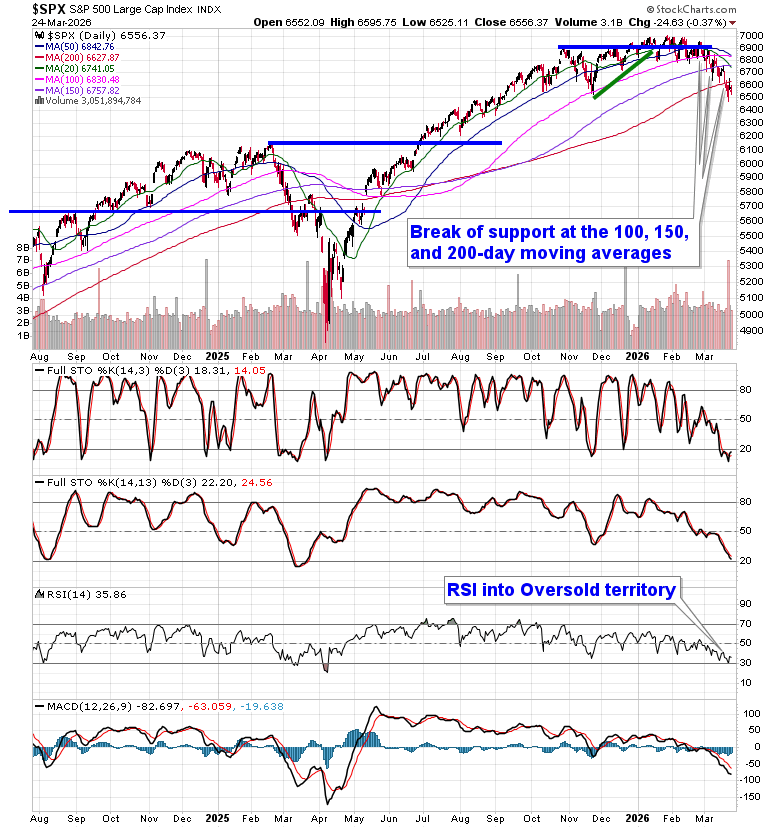
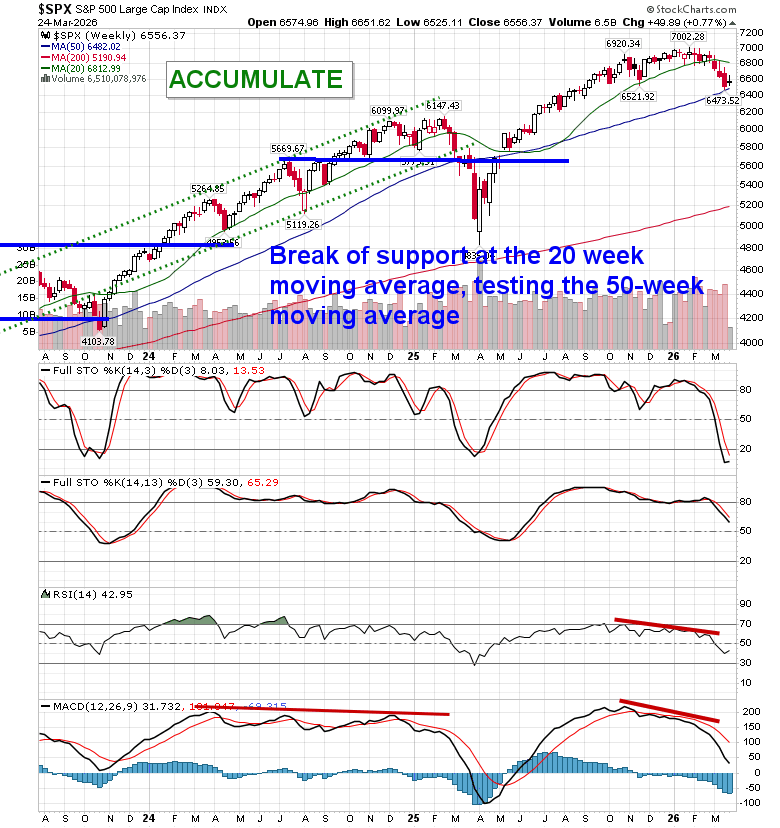
A tick higher in the price of oil and the cost of borrowing following Monday’s abrupt decline kept stocks on edge on Tuesday. The S&P 500 Index closed down by just less than four-tenths of one percent, reaching back into and starting to close the substantial upside gap charted at Monday’s open between 6500 and 6575; it will be important for the period of seasonal strength in the equity markets through the weeks ahead that this span holds. The benchmark continues to abide by the limits of its declining trend channel (lower limit was tested on Friday) and the band between 6500 and 6600 that we have speculated as likely to provide support is holding, for now. As highlighted in our report at the end of last week, the probability of downside exhaustion in the near-term is quite good with the Relative Strength Index (RSI) testing levels below 30 for the first time since the Liberation Day selloff last April. In the Seasonal Advantage Portfolio that we manage for clients at CastleMoore, we added to risk exposure at the end of last week for the seasonally strong window that runs through the next four to six weeks. The conflict in Iran remains a wildcard, but we do not have the indications that would be required to suggest abandoning our seasonal mandate calling for strength in stocks at least into early April; beyond this period, we certainly have concerns and we will look to address each of them in our reports to subscribers through the weeks ahead. Subscribers can view the themes in our chart books to either Accumulate or Avoid that are working and intact.
Today, in our Market Outlook to subscribers, we discuss the following:
- Market Action: Pullback Within a Fragile Rebound
- Technical Setup
- Macro Drivers: Oil + Rates Still the Key Headwinds
- Economy Check: No Derailment (Yet)
- Strategy: Stay the Course
- Sector Positioning and Enticing Stocks within Accumulate Rated Industries
- Growth Weakness: A Key Market Risk
- Forward Look: Tech Opportunity Coming Soon
Subscribers can look for this report in their inbox or by clicking on the following link and logging in: Market Outlook for March 25
Not signed up yet? Subscribe now to receive full access to all of the research and analysis that we publish
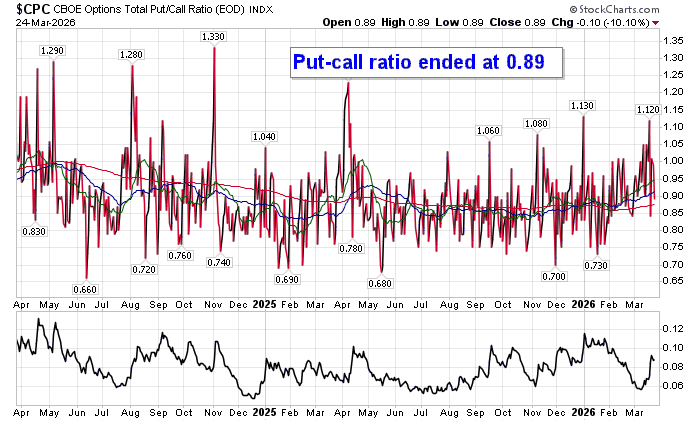
Sentiment on Tuesday, as gauged by the put-call ratio, ended bullish at 0.89.
Seasonal charts of companies reporting earnings today:


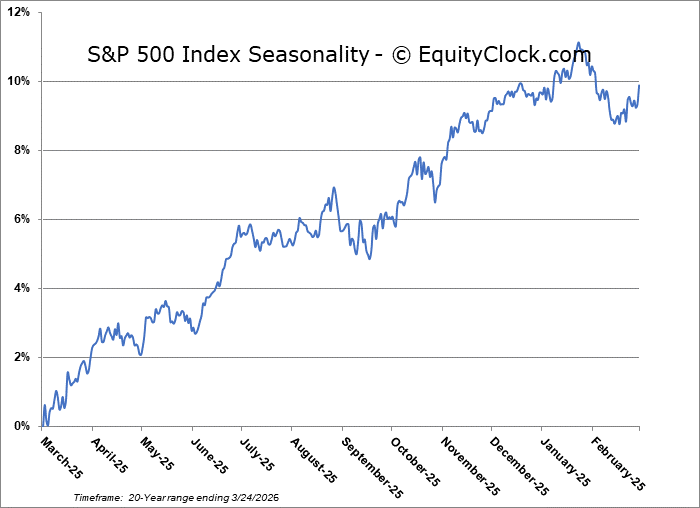
S&P 500 Index
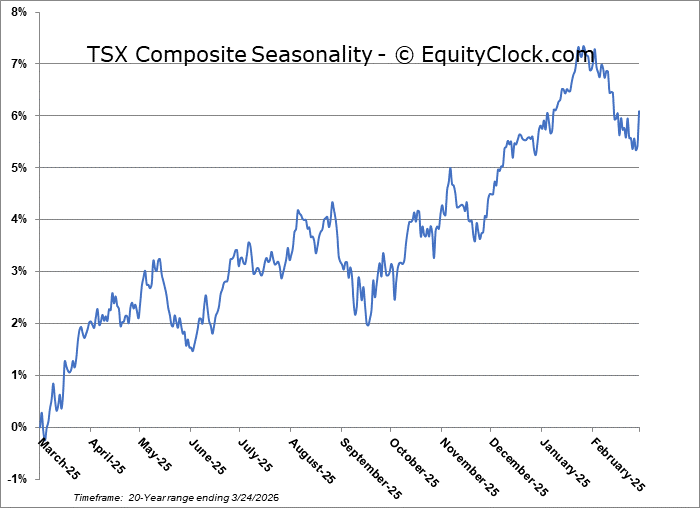
TSE Composite
| Sponsored By... |

|


