Stock Market Outlook for April 8, 2026

After strongly outperforming the market so far this year, our next trick is…
*** Stocks highlighted are for information purposes only and should not be considered as advice to purchase or to sell mentioned securities. As always, the use of technical and fundamental analysis is encouraged in order to fine tune entry and exit points to average seasonal trends.
Stocks Entering Period of Seasonal Strength Today:
Subscribers Click on the relevant link to view the full profile. Not a subscriber? Signup here.
Stock Highlight: |
|

Core Molding Technologies, Inc. (AMEX:CMT) Seasonal Chart |
|

HSBC Holdings PLC (NYSE:HSBC) Seasonal Chart

Digimarc Corp. (NASD:DMRC) Seasonal Chart
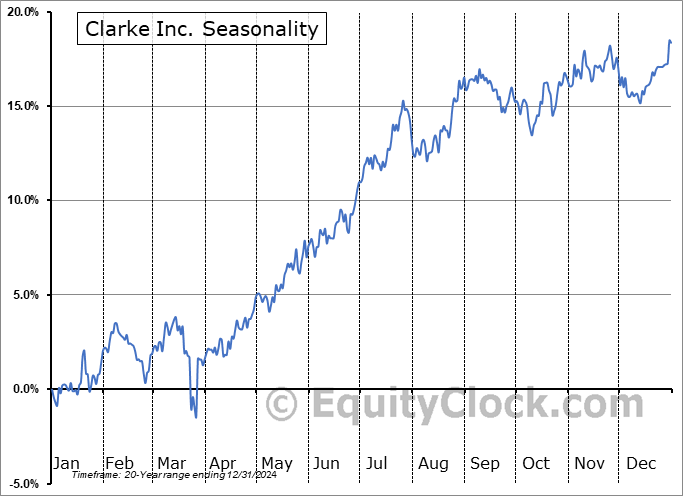
Clarke Inc. (TSE:CKI.TO) Seasonal Chart

Zai Lab, Ltd. (NASD:ZLAB) Seasonal Chart
Disclaimer: Comments and opinions offered in this report are for information only. They should not be considered as advice to purchase or to sell mentioned securities. Data offered is believed to be accurate, but is not guaranteed.
The Markets
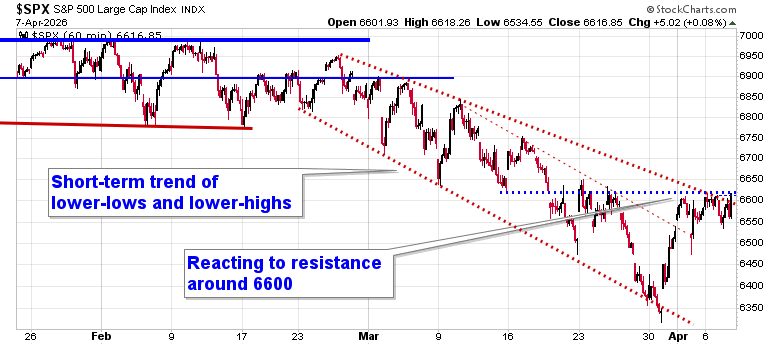
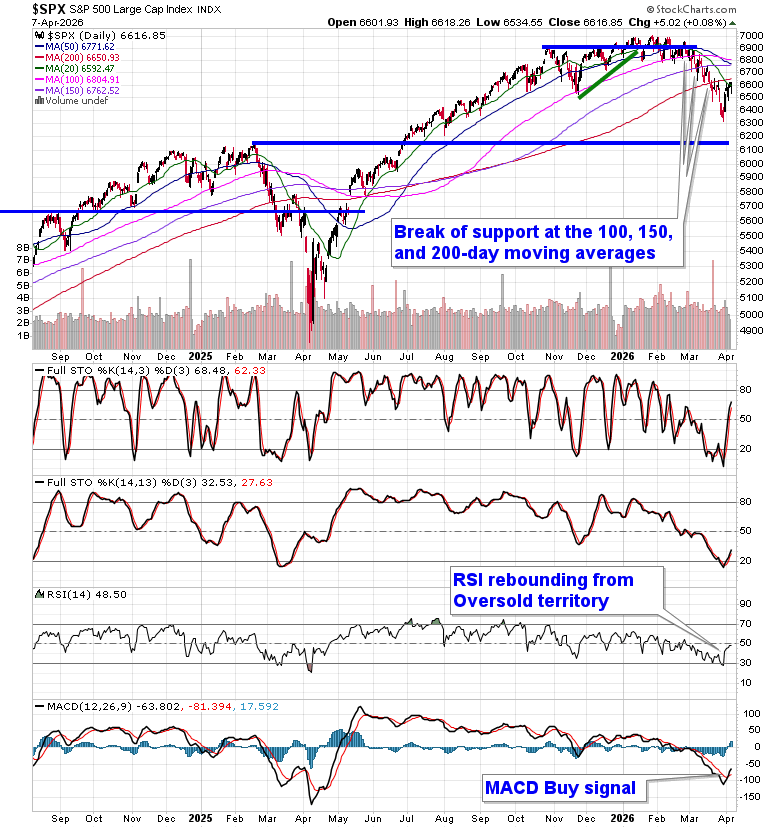
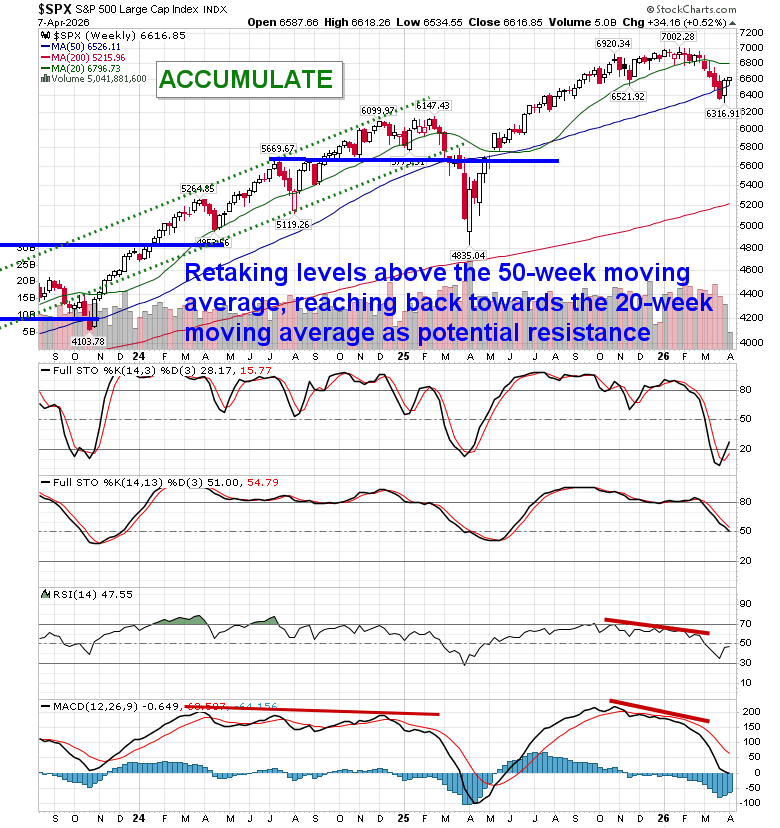
Stocks were volatile heading into the Trump imposed deadline of 8pm ET for Iran to reach a deal to end the war and open the Strait of Hormuz. After falling sharply early in the session, the S&P 500 Index added just less than a tenth of one percent, continuing to react to the upper limit of its declining short-term trading range, as well as horizontal resistance from the past couple of weeks, around 6620; the benchmark remains at a make or break point to the rebound that has elevated stocks into the start of this seasonally strong month of April. The appearance of a head-and-shoulders pattern around the aforementioned horizontal support, deemed to be the neckline to what could become a bullish setup, proposes an upside resolution to 6900, or back to the important pivot point in the market that we had highlighted in January and February; the 6620 horizontal barrier needs to break first in order to entice the upside target that the pattern attests and draw in some of the sidelined cash that has resulted from the risk aversion in recent weeks. Major daily moving averages continue to provide formidable hurdles for the benchmark to overcome in order to sustain the recovery through the weeks ahead. Market participants are watching the 200-day moving average (currently at 6650) like a hawk, emphasizing that “nothing good happens below this level.” However, with this negativity that investors have adopted around this important technical hurdle, we cannot dismiss the prospect of a contrarian move above the threshold that shakes the negative sentiment of many and draws traders back in before what could be another round of weakness in equity markets later this spring (aligned with how stocks perform in mid-term election years under a new presidential party). In the Seasonal Advantage Portfolio (which is firmly higher YTD) that we manage for clients at CastleMoore, we have been playing the contrarian after rotating away from our low volatility posture and adding to risk around the last week of March. The conflict in Iran remains a wildcard and we are running down our cues that would warrant a more defensive posture in risk assets, but the net of all developments following the action from the past couple of weeks between technicals, fundamentals, and seasonals for the near-term continue to provide the edge to an upside bias (and it has been working). Subscribers can view the updated list of themes in our chart books to either Accumulate or Avoid that we continue to gear portfolios towards.
Today, in our Market Outlook to subscribers, we discuss the following:
- Market Setup: Still at a Make-or-Break Level
- Contrarian Setup Strengthening
- Macro Risk: Iran Conflict Still the Key Driver
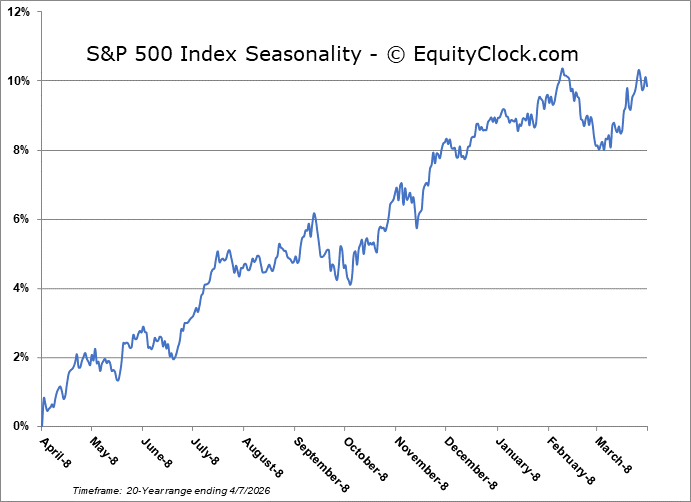
- Seasonal Tailwind Supporting Risk
- Manufacturing: Still Holding Up (For Now)
- Aerospace: Continuing to climb despite February turbulence
Core-cyclicals Still Leading- Our Next Rotation Candidate
- Portfolio Strategy: Tactical and Rotational
Subscribers can look for this report in their inbox or by clicking on the following link and logging in: Market Outlook for April 8
Not signed up yet? Subscribe now to receive full access to all of the research and analysis that we publish
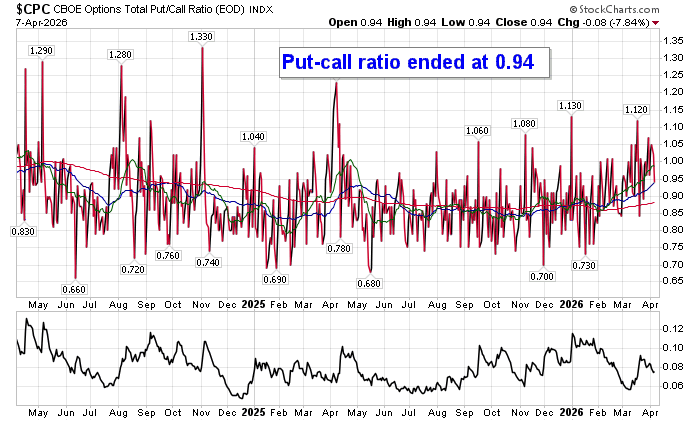
Sentiment on Tuesday, as gauged by the put-call ratio, ended close to neutral at 0.94.
Seasonal charts of companies reporting earnings today:


S&P 500 Index
TSE Composite
| Sponsored By... |

|


