Stock Market Outlook for April 9, 2026

We’ve taken the contrarian view and we have been winning with our disciplined three-pronged approach.
*** Stocks highlighted are for information purposes only and should not be considered as advice to purchase or to sell mentioned securities. As always, the use of technical and fundamental analysis is encouraged in order to fine tune entry and exit points to average seasonal trends.
Stocks Entering Period of Seasonal Strength Today:
Subscribers Click on the relevant link to view the full profile. Not a subscriber? Signup here.
Stock Highlight: |
|

Safe Bulkers Inc. (NYSE:SB) Seasonal Chart |
|
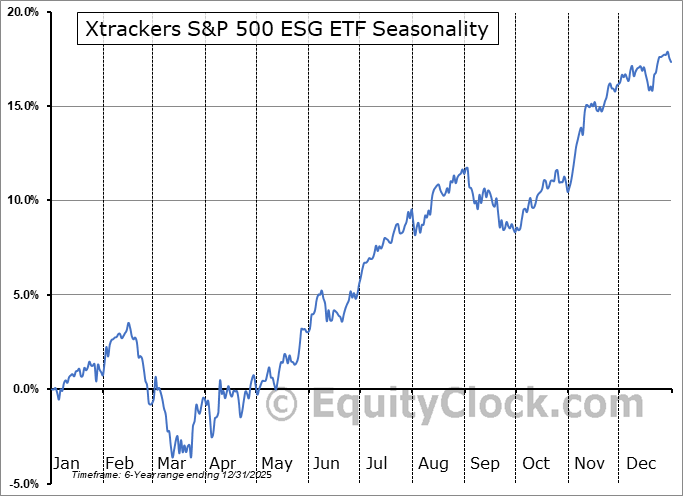
Xtrackers S&P 500 ESG ETF (AMEX:SNPE) Seasonal Chart

B. Riley Financial Inc (NASD:RILYP) Seasonal Chart
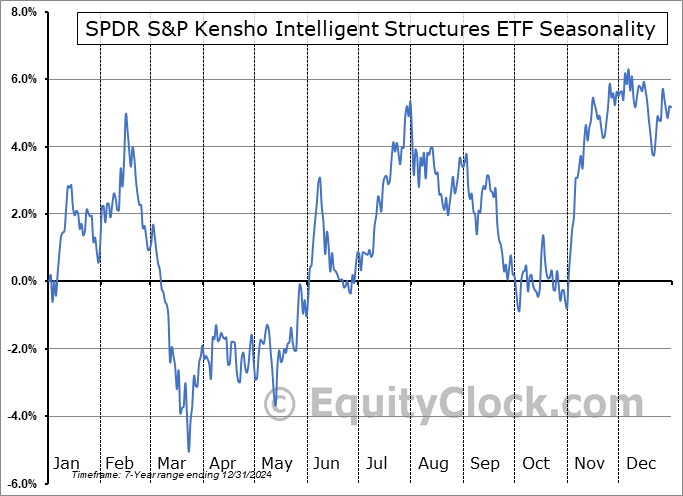
SPDR S&P Kensho Intelligent Structures ETF (AMEX:SIMS) Seasonal Chart

Acushnet Holdings Corp. (NYSE:GOLF) Seasonal Chart

SPDR S&P 600 Small Cap Growth ETF (NYSE:SLYG) Seasonal Chart

iShares S&P Small-Cap 600 Growth ETF (NASD:IJT) Seasonal Chart
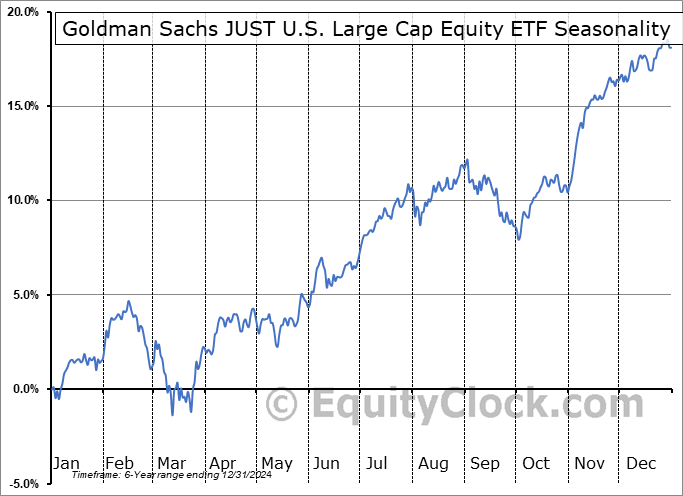
Goldman Sachs JUST U.S. Large Cap Equity ETF (AMEX:JUST) Seasonal Chart

Republic Bancorp, Inc. (NASD:RBCAA) Seasonal Chart

BioCryst Pharmaceuticals, Inc. (NASD:BCRX) Seasonal Chart

AZZ, Inc. (NYSE:AZZ) Seasonal Chart
Disclaimer: Comments and opinions offered in this report are for information only. They should not be considered as advice to purchase or to sell mentioned securities. Data offered is believed to be accurate, but is not guaranteed.
The Markets
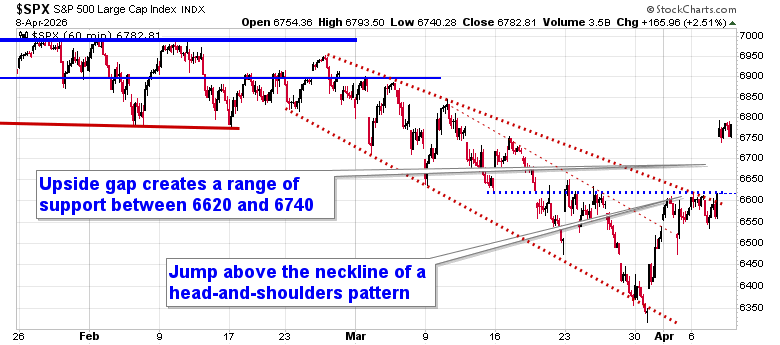
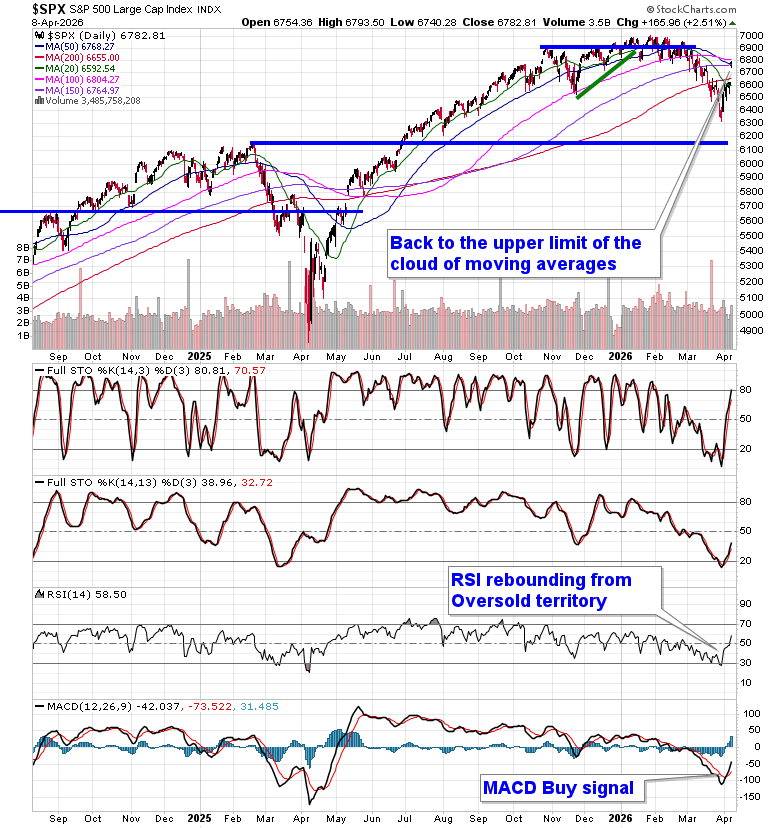
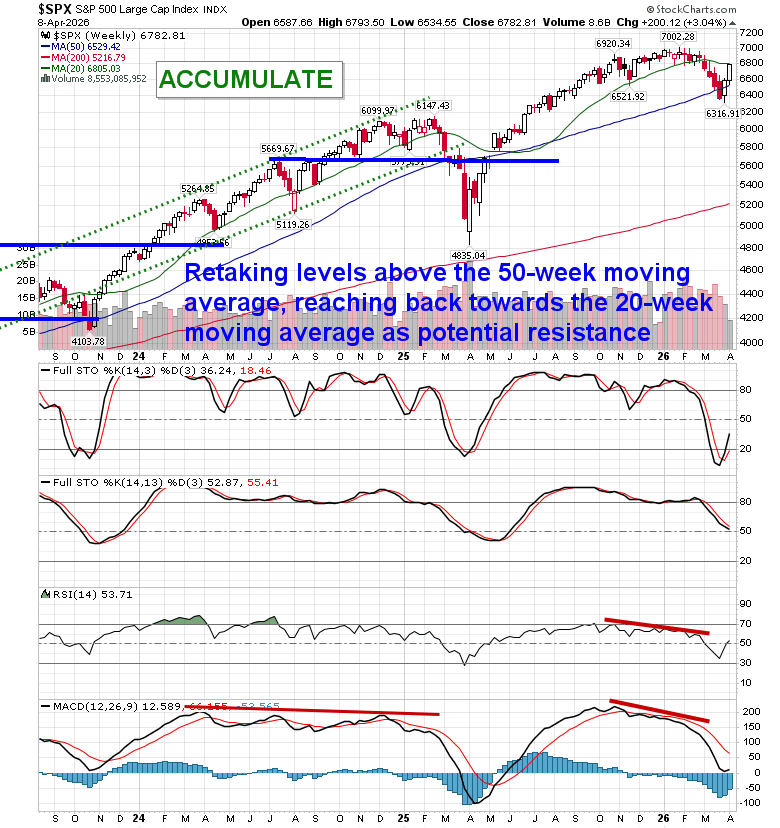
Stocks surged on Wednesday as Trump backed down on his threats of Iran destruction and a ceasefire between the two countries was apparently agreed to (although questions remain pertaining to whether or not it will hold and under what terms). The S&P 500 Index gapped higher by 2.51%, breaking above the upper limit of its declining short-term trading range, as well as horizontal resistance from the past couple of weeks, around 6620. The jump above the range between 6620 and 6740 creates a zone of support below the market, flipping the script from the past month and a half of resistance holding greater importance than support. The break above the neckline of a head-and-shoulders pattern around the aforementioned horizontal barrier proposes an upside resolution to 6900, or back to the important pivot point in the market that we had highlighted in January and February. The 200-day moving average, which had been heavily scrutinized by many in recent weeks, has been retaken and the upper limit of the cloud of moving averages at 6800 is being tested. The negativity that investors had adopted around the 200-day moving average was suggesting that traders had become offside in their market positioning, ill-prepared for the type of move that was realized on Wednesday. We have been looking at the prospect of a contrarian move above the threshold that shakes the negative sentiment of many and draws traders back in before what could be another round of weakness in equity markets later this spring (aligned with how stocks perform in mid-term election years under a new presidential party). So far, this has proven to be the correct stance. In the Seasonal Advantage Portfolio (which is strongly higher YTD and back to its high watermark that was charted in February) that we manage for clients at CastleMoore, we have been playing the contrarian after rotating away from our low volatility posture and adding to risk around the last week of March. The conflict in Iran remains a wildcard and we are running down our cues that would warrant a more defensive posture in risk assets, but the net of all developments following the action from the past couple of weeks between technicals, fundamentals, and seasonals have provided the edge to an upside bias (and it has been working). Subscribers can view the updated list of themes in our chart books to either Accumulate or Avoid that we continue to gear portfolios towards.
Today, in our Market Outlook to subscribers, we discuss the following:
- Breakout Confirmed: Market Regains Upside Momentum
- Contrarian Strategy Validated
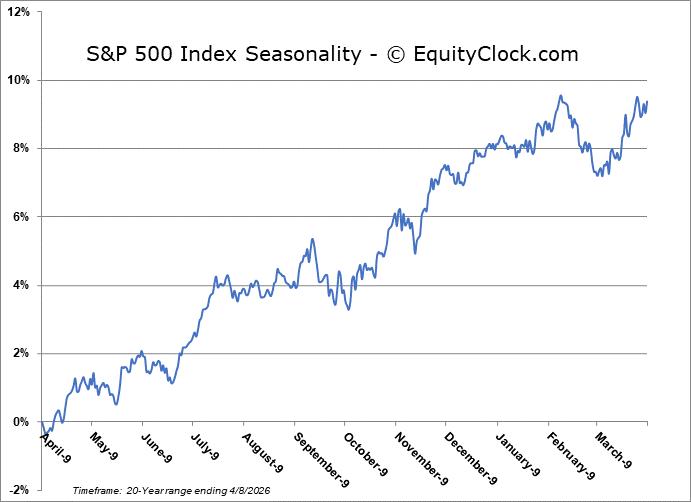
- Seasonality + Fundamentals + Technicals Still Supportive
- Macro Backdrop: Not Recessionary (Yet)
- Leadership: Cyclicals Still in Control
- Energy: Pullback = Opportunity
- Oil Still a Macro Risk
- Portfolio Positioning
Subscribers can look for this report in their inbox or by clicking on the following link and logging in: Market Outlook for April 9
Not signed up yet? Subscribe now to receive full access to all of the research and analysis that we publish
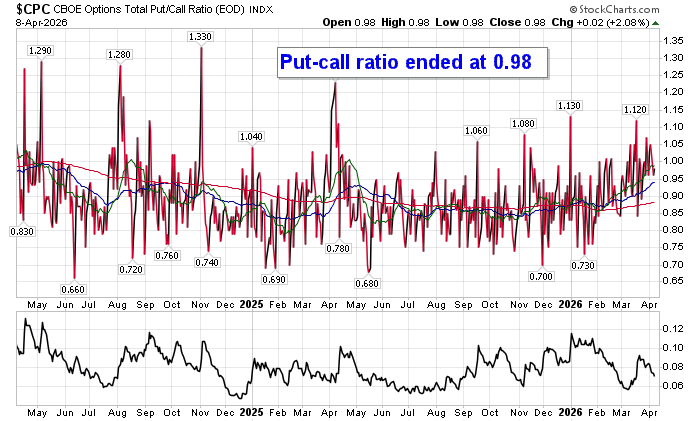
Sentiment on Wednesday, as gauged by the put-call ratio, ended close to Neutral at 0.98.
Seasonal charts of companies reporting earnings today:


S&P 500 Index
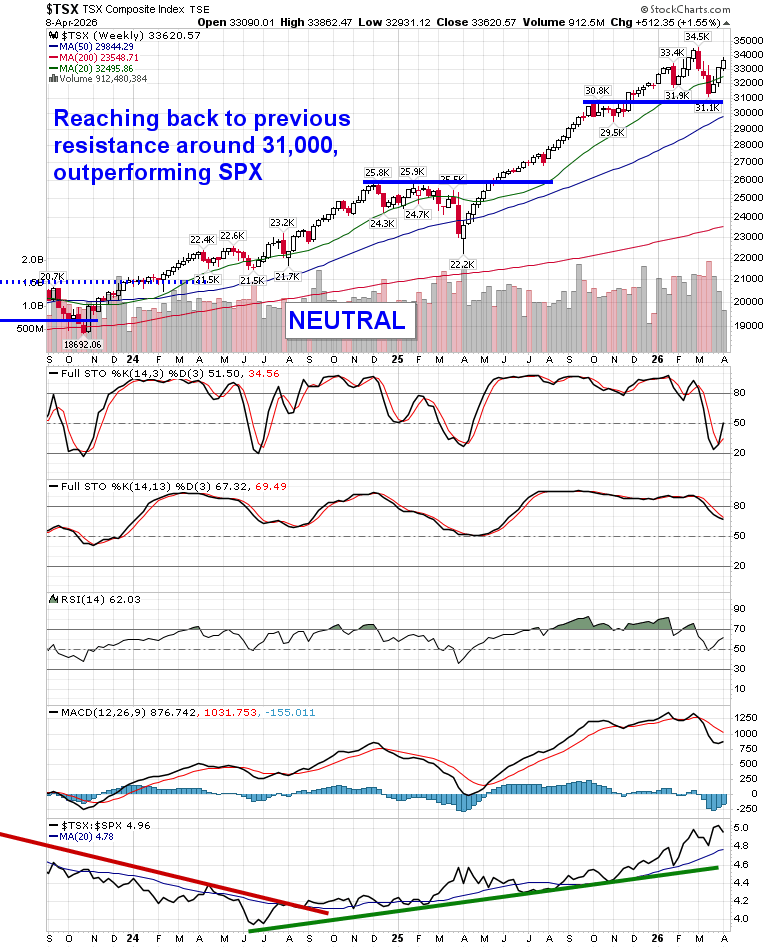
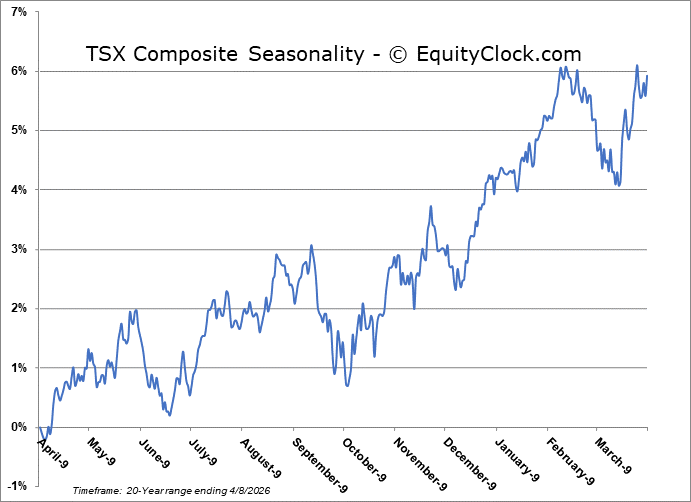
TSE Composite
| Sponsored By... |

|


