Stock Market Outlook for October 29, 2021

High Beta is back on an outperforming path versus Low Volatility, conducive to a risk-on bias in the market.
Â
Â
Â
*** Stocks highlighted are for information purposes only and should not be considered as advice to purchase or to sell mentioned securities.  As always, the use of technical and fundamental analysis is encouraged in order to fine tune entry and exit points to average seasonal trends.
Stocks Entering Period of Seasonal Strength Today:
Subscribers – Click on the relevant link to view the full profile. Not a subscriber? Signup here.
Analog Devices, Inc. (NASD:ADI) Seasonal Chart
Equifax, Inc. (NYSE:EFX) Seasonal Chart
Dorel Industries Inc. – Class B (TSE:DII/B.TO) Seasonal Chart
Vulcan Materials Co. (NYSE:VMC) Seasonal Chart
Canfor Corp. (TSE:CFP.TO) Seasonal Chart
Churchill Downs, Inc. (NASD:CHDN) Seasonal Chart
Martin Marietta Materials (NYSE:MLM) Seasonal Chart
Brunswick Corp. (NYSE:BC) Seasonal Chart
Copart, Inc. (NASD:CPRT) Seasonal Chart
Heartland Express, Inc. (NASD:HTLD) Seasonal Chart
NXP Semiconductor N.V. (NASD:NXPI) Seasonal Chart
iShares Core S&P Total US Stock Market ETF (NYSE:ITOT) Seasonal Chart
SPDR S&P Midcap 400 ETF (NYSE:MDY) Seasonal Chart
CIGNA Corp. (NYSE:CI) Seasonal Chart
Genuine Parts Co. (NYSE:GPC) Seasonal Chart
Cemex SA (NYSE:CX) Seasonal Chart
Cooper Tire & Rubber Co. (NYSE:CTB) Seasonal Chart
Beacon Roofing Supply Inc. (NASD:BECN) Seasonal Chart
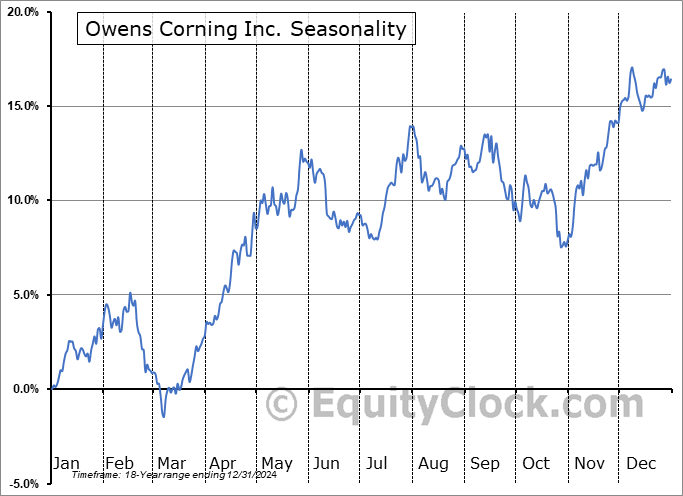
Owens Corning Inc. (NYSE:OC) Seasonal Chart
iShares North American Tech-Multimedia Networking ETF (NYSE:IGN) Seasonal Chart
Vanguard S&P Mid-Cap 400 Value ETF (NYSE:IVOV) Seasonal Chart
iShares Russell 3000 ETF (NYSE:IWV) Seasonal Chart
Vanguard Industrials ETF (NYSE:VIS) Seasonal Chart
Industrial Select Sector SPDR Fund (NYSE:XLI) Seasonal Chart
Â
Â
The Markets
Stocks snapped back on Thursday as earnings results continue to keep traders in buying mode. The S&P 500 Index gained just less than one percent, charting a fresh record closing high and reaching back towards psychological resistance that was tested in the previous session around 4600. The strength of the trend of momentum indicators has started to wane into the last few days of the month as portfolio managers seek to rebalance their books ahead of the end of the period. Still, there is little standing in the way of stocks at this juncture, despite these record high levels, and the market remains setup well to realize the strength that is notorious for the last couple of months of the year. Short and intermediate levels of support can continue to be pegged to 20 and 50-day moving averages, which are converging on one another around 4455.
Today, in our Market Outlook to subscribers, we discuss the following:
- Caterpillar (CAT) stock
- The correlation of Caterpillar to emerging market stocks
- High Beta versus Low Volatility stocks
- Average performance of the S&P 500 Index following the first anniversary of a recession market low and what to expect ahead
- S&P 500 Index during post presidential years
- Weekly jobless claims and the health of the labor market
- Natural gas inventories and the price of the commodity
- Investor sentiment
Subscribe now and we’ll send this outlook to you.
Sentiment on Thursday, as gauged by the put-call ratio, ended bullish at 0.66.Â
Â
Â
Seasonal charts of companies reporting earnings today:
Â
Â
S&P 500 Index
Â
Â
TSE Composite
| Sponsored By... |

|


