Stock Market Outlook for November 2, 2021

Small-caps breakout, providing a strong argument to be risk-on in investment portfolios.
Â
Â
Â
*** Stocks highlighted are for information purposes only and should not be considered as advice to purchase or to sell mentioned securities.  As always, the use of technical and fundamental analysis is encouraged in order to fine tune entry and exit points to average seasonal trends.
Stocks Entering Period of Seasonal Strength Today:
Subscribers – Click on the relevant link to view the full profile. Not a subscriber? Signup here.
Corning, Inc. (NYSE:GLW) Seasonal Chart
Lennar Corp. (NYSE:LEN) Seasonal Chart
Lincoln National Corp. (NYSE:LNC) Seasonal Chart
Peoples Bank (NASD:PBCT) Seasonal Chart
Hologic, Inc. (NASD:HOLX) Seasonal Chart
Cargojet Inc. (TSE:CJT.TO) Seasonal Chart
AMC Networks Inc. (NASD:AMCX) Seasonal Chart
FARO Technologies, Inc. (NASD:FARO) Seasonal Chart
Griffon Corp. (NYSE:GFF) Seasonal Chart
Uranium Energy Corp. (AMEX:UEC) Seasonal Chart
Pizza Pizza Royalty Corp. (TSE:PZA.TO) Seasonal Chart
Schwab US Large-Cap ETF (NYSE:SCHX) Seasonal Chart
Â
Â
The Markets
Stocks closed higher in the first session of November as risk-taking in the equity market continues. The S&P 500 Index added nearly two-tenths of one percent, inching higher above previous resistance at 4545. The previous hurdle remains in a position of support, along with the 20 and 50-day moving averages at 4481 and 4462, respectively. While we are delighted to see the equity market take off precisely on the cue that we provided to become fully invested in stocks as of the end of September, we must be cognizant that there will be ebbs and flows within the trend of higher-highs and higher-lows, even as we progress through the best six months for stocks. There is nothing to suggest a pullback is due, but following a sharp move higher, such as what has been observed over the past month, a pullback/consolidation is certainly reasonable. This is not necessarily a tradable gyration, but something to be aware of.
Today, in our Market Outlook to subscribers, we discuss the following:
- The breakout of small-cap stocks
- Notable upgrades and downgrade in this week’s chart books: Find out which industries have been downgraded to Avoid following weakness in recent weeks
- US Construction Spending and what is driving activity
Subscribe now and we’ll send this outlook to you.
Want to know which areas of the market to buy or sell? Our Weekly Chart Books have just been updated, providing a clear Accumulate, Avoid, or Neutral rating for currencies, cryptocurrencies, commodities, broad markets, and subsectors/industries of the market. Subscribers can login and click on the relevant links to access.
Subscribe now.
Reminder…
Our monthly report for November is out, providing you with everything that you need to know from a seasonal, technical, and fundamental perspective through the months ahead.
Highlights in this report include:
- Equity market tendencies in the month of November
- Rejuvenation of breadth following the summer consolidation
- Broad equity market strength
- Breakdown in bonds relative to stocks, confirming our bias towards the latter
- Cyclical bent
- Industrial production and the impact from Hurricane Ida
- Manufacturer sentiment
- Manufacturer employment flourishing
- Workers quitting at a rapid pace, a positive for the health of the labor market
- Time to shift focus to smaller cap stocks
- Mid-Caps
- High Beta vs Low Volatility
- Interesting juncture for the technology sector
- Bond yields reaching back towards the highs of the year
- Tracking the spread of COVID
- Pharmaceuticals
- Health Care Providers
- Seasonal trade in retail stocks with the upcoming holiday spending period
- Demand for energy products during the historically slower time of the year for driving activity
- The derivative trade to high energy prices
- Existing Home Sales
- Average equity market performance during the second year of a recovery
- The technical status of the S&P 500 Index
- Seasonal decline in volatility into the end of the year
- Positioning for the months ahead
- Sector reviews and ratings
- Stocks that have frequently gained in the month of November
- Notable stocks and ETFs entering their period of strength in November
Subscribers can look for this 119-page report in your inbox or download it directly from the report archive at https://charts.equityclock.com/
Subscribe now and we’ll send this outlook to you.
Sentiment on Monday, as gauged by the put-call ratio, ended bullish at 0.77.
Â
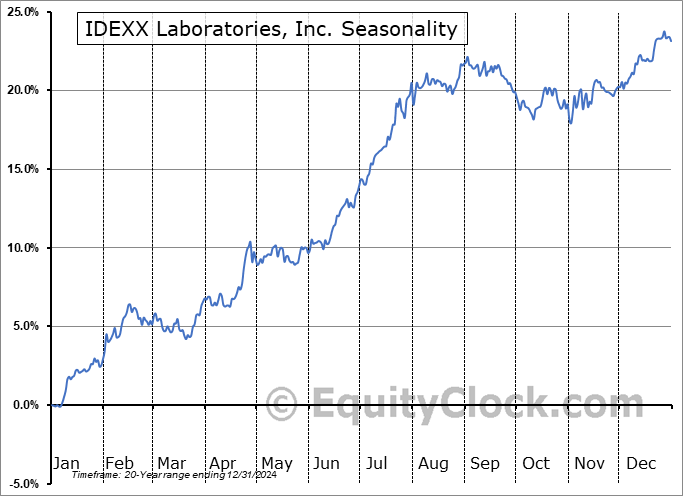
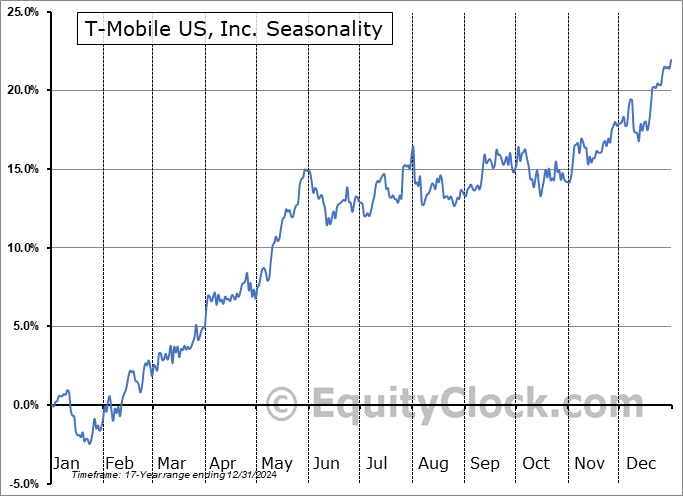
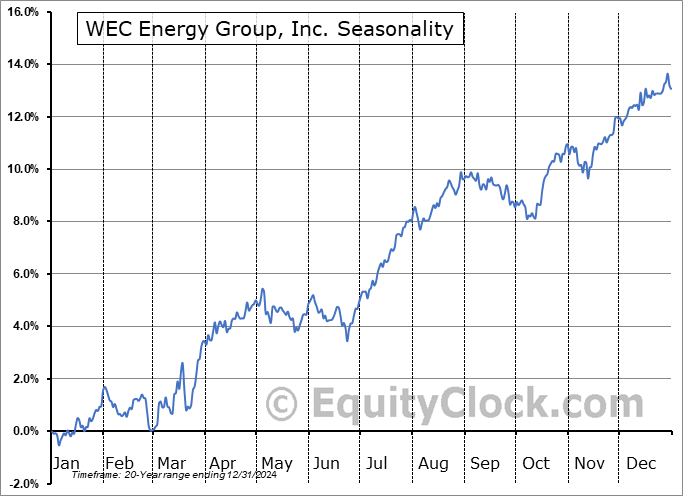
Seasonal charts of companies reporting earnings today:
Â
Â
S&P 500 Index
Â
Â
TSE Composite
| Sponsored By... |

|


