Stock Market Outlook for July 20, 2022

There is an elevated risk of an aggressive and wide-spread respiratory illness season this year, something that could stand in the way of the normal functioning of the economy through year-end.
*** Stocks highlighted are for information purposes only and should not be considered as advice to purchase or to sell mentioned securities. As always, the use of technical and fundamental analysis is encouraged in order to fine tune entry and exit points to average seasonal trends.
Stocks Entering Period of Seasonal Strength Today:
Subscribers – Click on the relevant link to view the full profile. Not a subscriber? Signup here.
ProShares S&P 500 Dividend Aristocrats ETF (NYSE:NOBL) Seasonal Chart
John Hancock Multifactor Industrials ETF (AMEX:JHMI) Seasonal Chart
NorthEast Community Bancorp Inc. (NASD:NECB) Seasonal Chart
Schwab Intermediate-Term U.S. Treasury ETF (NYSE:SCHR) Seasonal Chart
Scholastic Corp. (NASD:SCHL) Seasonal Chart
Primerica Inc. (NYSE:PRI) Seasonal Chart
Allied Properties Real Estate Investment Trust (TSE:AP/UN.TO) Seasonal Chart
The Markets
Stocks rallied on Tuesday as short-term barriers that have capped upside momentum over the past month start to break. The S&P 500 Index jumped by 2.76%, closing above short-term horizontal resistance around 3925. Declining trendline resistance that has been intact for the past few months has also been overcome as the benchmark takes a stab at the declining 50-day moving average. The open downside gap between 3975 and 4020 is the next major test overhead as the bulls seek to gather the strength to shake off the negativity that has plagued the market since the year began. Still, much more work is required to suggest a conclusion to the negative intermediate path of lower-lows and lower-highs that the benchmark has been in all year.
Today, in our Market Outlook to subscribers, we discuss the following:
- Hourly chart of the S&P 500 Index and the break of short-term horizontal resistance
- Leadership of small-cap stocks
- Trend of high-yield spreads
- US Housing starts and the stocks of the builders
- The trend of COVID compared to the seasonal norm for respiratory illnesses
Subscribers can look for this report in their inbox or by clicking on the following link and logging in: Market Outlook for July 20
Not signed up yet? Subscribe now to receive full access to all of the research and analysis that we publish.
Sentiment on Tuesday, as gauged by the put-call ratio, ended close to neutral at 0.96.
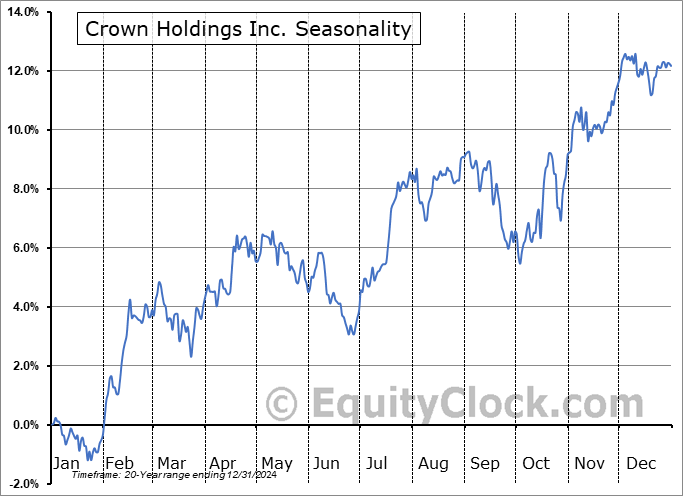
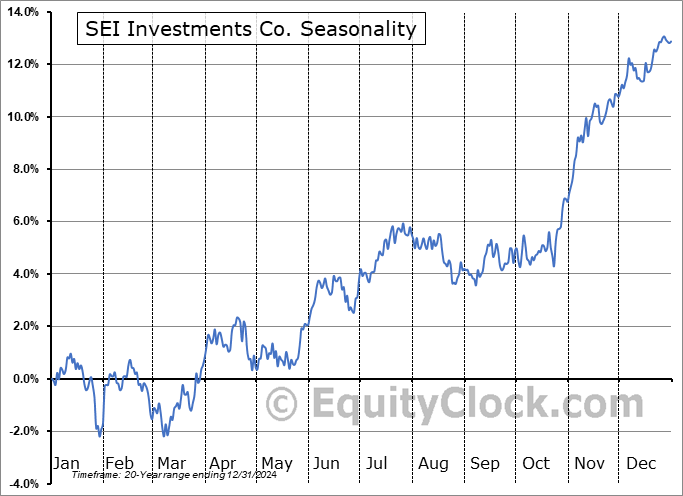
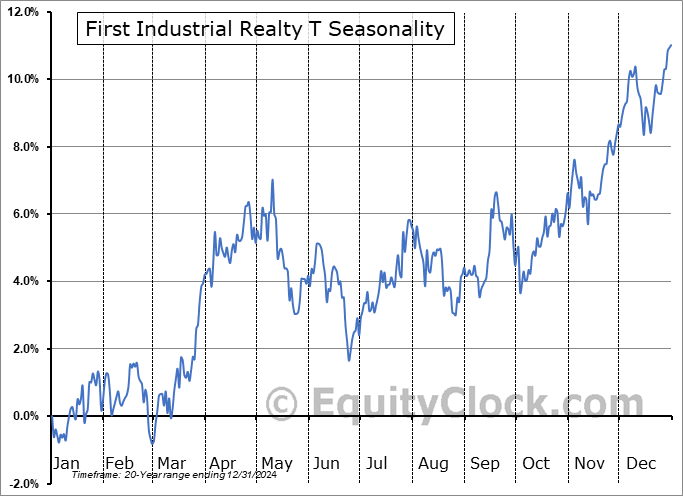
Seasonal charts of companies reporting earnings today:
S&P 500 Index
TSE Composite
| Sponsored By... |

|


