Stock Market Outlook for August 31, 2023

A sharp draw of oil inventories last week has erased virtually all of the injection to stockpiles that was recorded earlier this year.
*** Stocks highlighted are for information purposes only and should not be considered as advice to purchase or to sell mentioned securities. As always, the use of technical and fundamental analysis is encouraged in order to fine tune entry and exit points to average seasonal trends.
Stocks Entering Period of Seasonal Strength Today:
Subscribers Click on the relevant link to view the full profile. Not a subscriber? Signup here.
Under Armour, Inc. (NYSE:UA) Seasonal Chart
Vanguard International High Dividend Yield ETF (NASD:VYMI) Seasonal Chart
SPDR S&P North American Natural Resources ETF (AMEX:NANR) Seasonal Chart
Invesco S&P 500 Equal Weight Consumer Discretionary ETF (NYSE:RCD) Seasonal Chart
iShares Currency Hedged MSCI EAFE ETF (AMEX:HEFA) Seasonal Chart
Metlife, Inc. (NYSE:MET) Seasonal Chart
The Markets
Stocks closed higher for a fourth straight session on Wednesday as the normal drift higher into the Labor day long weekend continues. The S&P 500 Index closed with a gain of just less than four-tenths of one percent, moving further above resistance at 20 and 50-day moving averages that were broken in the prior session. Downside gap resistance between 4550 and 4575 is the next major hurdle to watch as this kicked off the normal August slump, coinciding with the period of volatility for stocks during the third quarter. The weakest time of year for the equity market is still ahead, spanning the last half of September, and we have no reason to expect a deviation compared to the seasonal norm ahead of the best six months of the year period for stocks that starts in October.
Soon to be released…
We are busy putting the finishing touches on our Monthly Outlook for September, providing you with everything that you need to know for the month(s) ahead.
Subscribers can look for this report in their inbox in the day ahead.
Today, in our Market Outlook to subscribers, we discuss the following:
- Weekly Petroleum Status and the price of oil
- Canadian Stocks
- Canadian Dollar
- US International Trade
Subscribers can look for this report in their inbox or by clicking on the following link and logging in: Market Outlook for August 31
Not signed up yet? Subscribe now to receive full access to all of the research and analysis that we publish.
Sentiment on Wednesday, as gauged by the put-call ratio, ended bearish at 1.14.
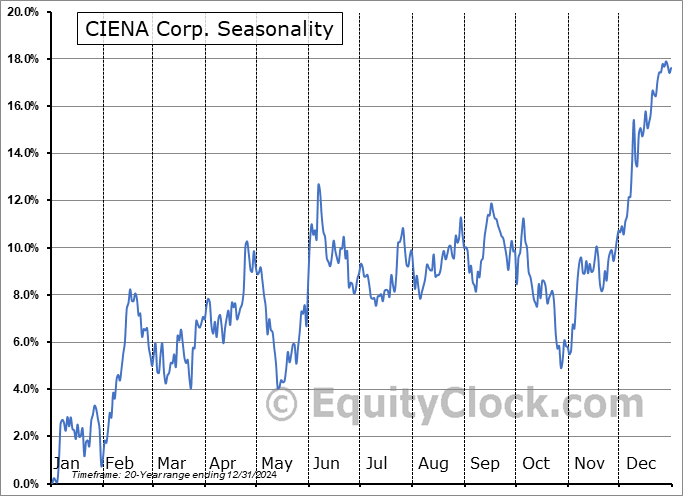
Seasonal charts of companies reporting earnings today:
S&P 500 Index
TSE Composite
| Sponsored By... |

|


