Stock Market Outlook for January 11, 2024

The strength in Small Caps, Value, and Equal Weight is failing to carry into the new year, something that is abnormal from a seasonal perspective.
*** Stocks highlighted are for information purposes only and should not be considered as advice to purchase or to sell mentioned securities. As always, the use of technical and fundamental analysis is encouraged in order to fine tune entry and exit points to average seasonal trends.
Stocks Entering Period of Seasonal Strength Today:
Subscribers Click on the relevant link to view the full profile. Not a subscriber? Signup here.
Invesco S&P SmallCap Utilities ETF (NASD:PSCU) Seasonal Chart
ProShares Large Cap Core Plus (NYSE:CSM) Seasonal Chart
Ball Corp. (NYSE:BALL) Seasonal Chart
Fortis Inc. (NYSE:FTS) Seasonal Chart
Kimberly Clark Corp. (NYSE:KMB) Seasonal Chart
Physicians Realty Trust (NYSE:DOC) Seasonal Chart
Monroe Capital Corp. (NASD:MRCC) Seasonal Chart
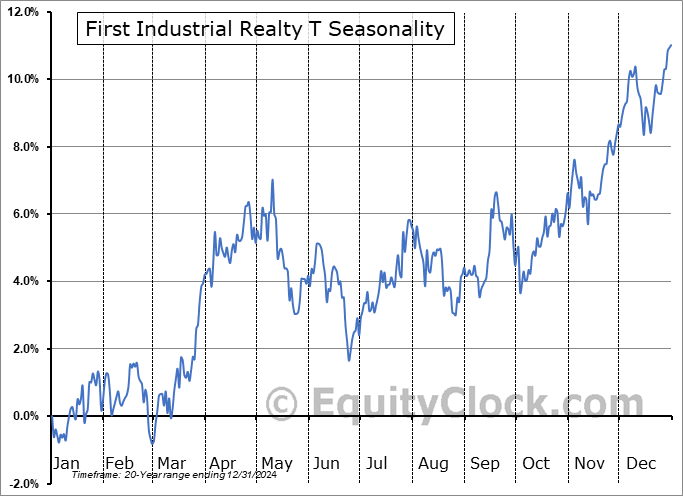
First Industrial Realty T (NYSE:FR) Seasonal Chart
Atmos Energy Corp. (NYSE:ATO) Seasonal Chart
Flowers Foods, Inc. (NYSE:FLO) Seasonal Chart
Agnico-Eagle Mines Ltd. (TSE:AEM.TO) Seasonal Chart
The Markets
Stocks rallied on Wednesday as traders constrain some of their negativity that entered the market to start the year and brace for the important Consumer Price Index (CPI) report slated to be released on Thursday and the start of earnings season with the major banks on Friday. The S&P 500 Index closed with a gain of almost six-tenths of one percent, elevating further above short-term support at its 20-day moving average that was tested into the end of last week. The benchmark is back to knocking on the door of significant resistance and the all-time high of 4800. The rollover of momentum indicators from overbought territory to start the year has taken a pause and they are holding above their middle lines, portraying characteristics of a bullish trend. As has been stated, there is uncertainty over the near-term path of the benchmark, but the intermediate-term path, spanning weeks and months, remains firmly positive, suggesting using near-term pullbacks to add to equity positions. The first couple of months of the year are typically a softer period for equity market performance as traders digest the strength that is average from the last couple of months of the year, but this digestion typically sets up for the tail-end to the best six month period for stocks that runs through March and April.
Today, in our Market Outlook to subscribers, we discuss the following:
- The lack of follow through of the strength in many areas that led the rally in the equity market in November and December
- Average tendency for stocks during election years and years ending in “4”
- Wholesale Sales and Inventories
- Visa US Spending Momentum Index seasonality
- Investor sentiment
Subscribers can look for this report in their inbox or by clicking on the following link and logging in: Market Outlook for January 11
Not signed up yet? Subscribe now to receive full access to all of the research and analysis that we publish.
Sentiment on Wednesday, as gauged by the put-call ratio, ended overly bearish at 1.45.
Seasonal charts of companies reporting earnings today:
S&P 500 Index
TSE Composite
| Sponsored By... |

|


