Stock Market Outlook for July 8, 2024

Economic momentum is waning, but this could be the catalyst for the third quarter rally in the bond market.
*** Stocks highlighted are for information purposes only and should not be considered as advice to purchase or to sell mentioned securities. As always, the use of technical and fundamental analysis is encouraged in order to fine tune entry and exit points to average seasonal trends.
Stocks Entering Period of Seasonal Strength Today:
Subscribers Click on the relevant link to view the full profile. Not a subscriber? Signup here.

Union First Market Bankshares Corp. (NYSE:AUB) Seasonal Chart

Premier Financial Corp. (NASD:PFC) Seasonal Chart

Financial Select Sector SPDR Fund (NYSE:XLF) Seasonal Chart

abrdn Physical Silver Shares ETF (NYSE:SIVR) Seasonal Chart
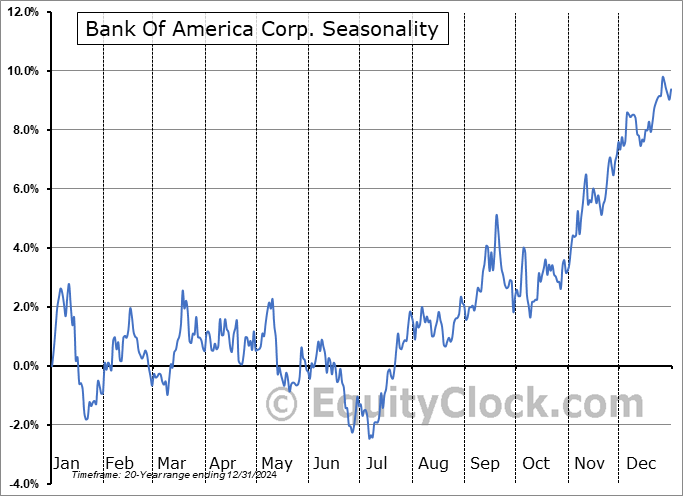
Bank Of America Corp. (NYSE:BAC) Seasonal Chart

Marcus Corp. (NYSE:MCS) Seasonal Chart

Nasdaq OMX Group Inc. (NASD:NDAQ) Seasonal Chart

Metlife, Inc. (NYSE:MET) Seasonal Chart

CF Industries Holdings, Inc. (NYSE:CF) Seasonal Chart

Goldman Sachs Group, Inc. (NYSE:GS) Seasonal Chart

Union Pacific Corp. (NYSE:UNP) Seasonal Chart

TFI International Inc. (TSE:TFII.TO) Seasonal Chart

Take-Two Interactive Software, Inc. (NASD:TTWO) Seasonal Chart

Fresh Del Monte Produce (NYSE:FDP) Seasonal Chart

Kinross Gold Corp. (NYSE:KGC) Seasonal Chart
The Markets
Stocks jumped higher on Friday, continuing to realize the benefit of summer rally timeframe. The S&P 500 Index ended higher by just over half of one percent, extending the bounce from the rising 20-day moving average (5452) and advancing beyond the 5555 target that the breakout of the consolidation span between 5445 and 5500 suggested. The summer rally engine is running strong as funds flow into many of the winners from the first half of the year, including Technology (XLK) and Communication Services (XLC), two segments of the market that tend to perform well seasonally ahead of the period of average volatility for stocks that gets underway in a couple of weeks from now. The 2.08% gain for the S&P 500 Index already far surpasses the 1.29% return that is average for the summer rally timeframe between June 27th and July 17th. Relative Strength Index (RSI) for the large-cap benchmark remains firmly embedded in overbought territory and MACD is back on the rise after breaking above declining trendline resistance in June. Despite poor breadth beneath the surface of the market, characteristics of a bullish trend are firmly entrenched as funds overwhelming plow into some of the few areas of the market that are actually working (see our list of Accumulate candidates). Major moving averages continue to “fan” out below price, providing a number of points of support below to catch prices should an event occur to destabilize the recent momentum. Seasonals and technicals suggest remaining bullish of stocks, but we will soon have to become cognizant of any triggers that may induce the period of average volatility for equity markets that follows and spans the remainder of the third quarter.

Today, in our Market Outlook to subscribers, we discuss the following:
- US Employment Situation and the investment implications within
- Canada Labour Force Survey and the unprecedented reliance on part-time employees
- The rise in resource employment
- The third strongest increase in Canadian unemployment over the past two decades
- Bonds
Subscribers can look for this report in their inbox or by clicking on the following link and logging in: Market Outlook for July 8
Not signed up yet? Subscribe now to receive full access to all of the research and analysis that we publish.
Sentiment on Friday, as gauged by the put-call ratio, ended slightly bullish at 0.90.

Seasonal charts of companies reporting earnings today:
 Seasonal Chart")
S&P 500 Index


TSE Composite


| Sponsored By... |

|


