Stock Market Outlook for July 23, 2024

The period of average volatility for stocks starts today and so too does the optimal holding period for a wide range of inverse ETFs.
*** Stocks highlighted are for information purposes only and should not be considered as advice to purchase or to sell mentioned securities. As always, the use of technical and fundamental analysis is encouraged in order to fine tune entry and exit points to average seasonal trends.
Stocks Entering Period of Seasonal Strength Today:
Subscribers Click on the relevant link to view the full profile. Not a subscriber? Signup here.
iShares Core U.S. Aggregate Bond ETF (NYSE:AGG) Seasonal Chart
Sixth Street Specialty Lending (NYSE:TSLX) Seasonal Chart
PrairieSky Royalty Ltd. (TSE:PSK.TO) Seasonal Chart
iShares 1-5 Year Laddered Government Bond Index ETF (TSE:CLF.TO) Seasonal Chart
Vanguard Canadian Short-Term Bond Index ETF (TSE:VSB.TO) Seasonal Chart
BMO Short Corporate Bond Index ETF (TSE:ZCS.TO) Seasonal Chart
BMO Short Provincial Bond Index ETF (TSE:ZPS.TO) Seasonal Chart
Vanguard Intermediate-Term Bond ETF (NYSE:BIV) Seasonal Chart
iShares 3-7 Year Treasury Bond ETF (NASD:IEI) Seasonal Chart
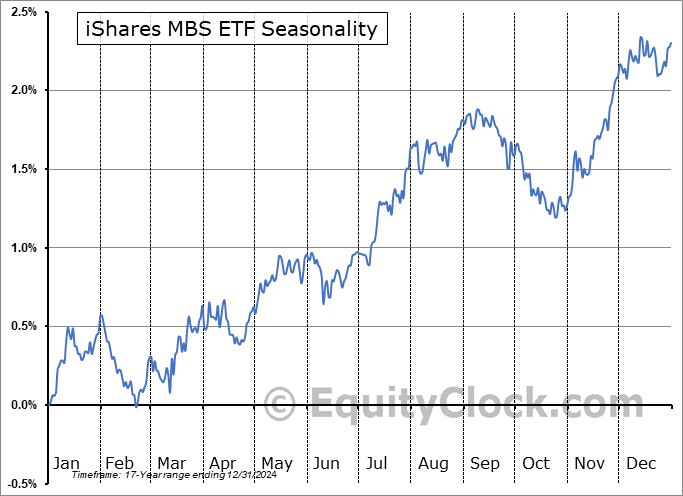
iShares MBS ETF (NASD:MBB) Seasonal Chart
abrdn Physical Gold Shares ETF (NYSE:SGOL) Seasonal Chart
Invesco DB US Dollar Index Bullish Fund (NYSE:UUP) Seasonal Chart
SPDR Portfolio High Yield Bond ETF (AMEX:SPHY) Seasonal Chart
The Markets
Stocks rallied on Monday, attempting to erase some of the decline recorded last week, as traders attempted to reload on some of the technology stocks that recorded steep declines in the past few days. The S&P 500 Index ended higher by 1.08%, retaking levels back above its 20-day moving average (5545) that was broken at the end of last week. Momentum remains near-term negative following last week’s decline, but some relief on the Relative Strength Index (RSI) around the 50-line is attempting to keep characteristics of a bullish trend intact. A short-term downside gap remains open between 5622 and 5658, a zone that will act as the cap to the summer rally that has now past its average peak. The time is here to prepare portfolio strategy for the period of volatility for stocks that runs through the next three months.
Today, in our Market Outlook to subscribers, we discuss the following:
- The most volatile period on the calendar is beginning
- The large number of inverse ETF beginning their optimal holding period today
- Bonds
- Our weekly chart books update, along with our list of all segments of the market to either Accumulate or Avoid
- Technology (semiconductors) vulnerable to near-term gravitation back to levels of trendline support
Subscribers can look for this report in their inbox or by clicking on the following link and logging in: Market Outlook for July 23
Not signed up yet? Subscribe now to receive full access to all of the research and analysis that we publish.
Want to know which areas of the market to buy or sell? Our Weekly Chart Books have just been updated, providing a clear Accumulate, Avoid, or Neutral rating for currencies, cryptocurrencies, commodities, broad markets, and subsectors/industries of the market. Subscribers can login and click on the relevant links to access.
- Currencies
- Cryptocurrencies
- Commodities
- Major Benchmarks
- Sub-sectors / Industries
- ETFs: Bonds | Commodities | Equity Markets | Industries | Sectors
Subscribe now.
Sentiment on Monday, as gauged by the put-call ratio, ended bullish at 0.89.
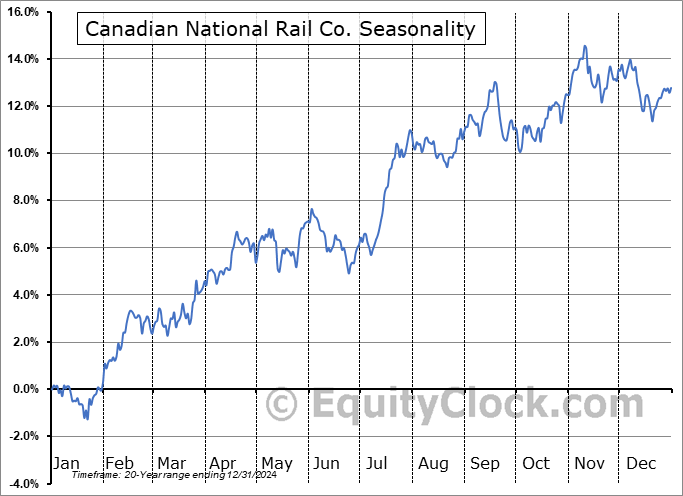
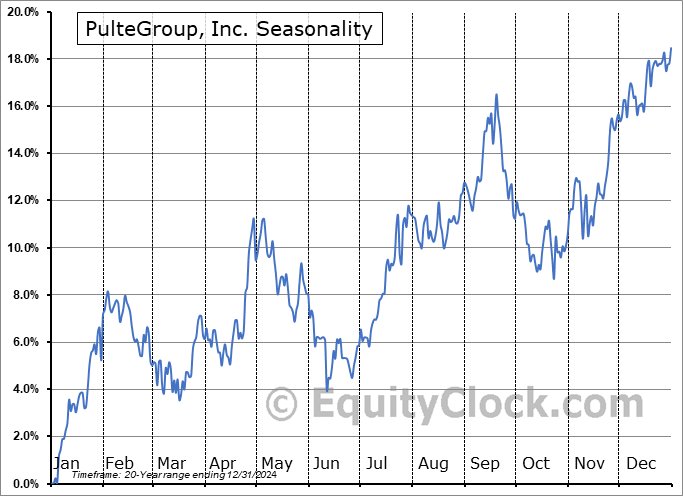
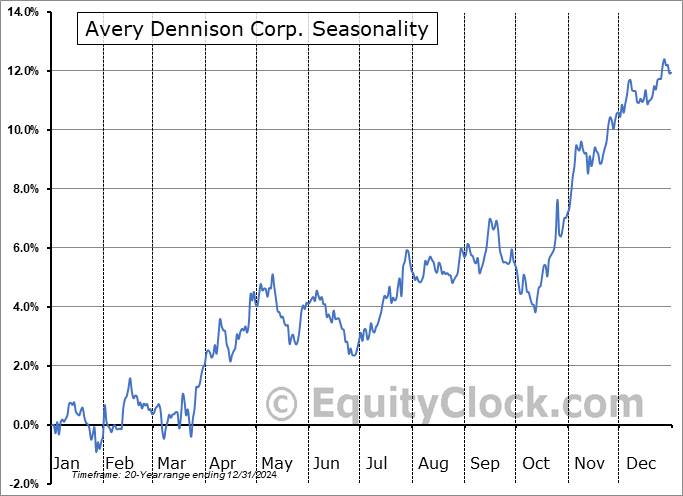
Seasonal charts of companies reporting earnings today:
S&P 500 Index
TSE Composite
| Sponsored By... |

|


