Stock Market Outlook for November 6, 2024

Heavy truck sales, often a reliable gauge of the strength of business demand, are failing to show the strength that consumer vehicle sales are portraying.
*** Stocks highlighted are for information purposes only and should not be considered as advice to purchase or to sell mentioned securities. As always, the use of technical and fundamental analysis is encouraged in order to fine tune entry and exit points to average seasonal trends.
Stocks Entering Period of Seasonal Strength Today:
Subscribers Click on the relevant link to view the full profile. Not a subscriber? Signup here.
Invesco S&P 500 Equal Weight Financials ETF (NYSE:RSPF) Seasonal Chart
iShares Core 5-10 Year USD Bond ETF (AMEX:IMTB) Seasonal Chart
Aware, Inc. (NASD:AWRE) Seasonal Chart
SPDR S&P 400 Mid Cap Value ETF (NYSE:MDYV) Seasonal Chart
iShares MSCI Frontier 100 ETF (AMEX:FM) Seasonal Chart
iShares MSCI USA Equal Weighted ETF (NYSE:EUSA) Seasonal Chart
Dividend Select 15 Corp (TSE:DS.TO) Seasonal Chart
Par Technology (NYSE:PAR) Seasonal Chart
Ag Growth International Inc. (TSE:AFN.TO) Seasonal Chart
Avadel Pharmaceuticals plc (NASD:AVDL) Seasonal Chart
Allied Properties Real Estate Investment Trust (TSE:AP/UN.TO) Seasonal Chart
Teva Pharmaceutical Industries Ltd. (NYSE:TEVA) Seasonal Chart
ACI Worldwide Inc. (NASD:ACIW) Seasonal Chart
Gildan Activewear, Inc. (TSE:GIL.TO) Seasonal Chart
TransAlta Corp. (TSE:TA.TO) Seasonal Chart
The Markets
Stocks jumped on Election Day Tuesday as market participants placed their final bets on the outcome before the vote count is released in the hours/days ahead. The S&P 500 Index closed higher by 1.23%, bouncing from the 50-day moving average (5706), but remaining below resistance at the 20-day moving average (5806). A zone of resistance remains in place between Thursday’s open at 5775 and Wednesday’s close at 5816, a span that was tested as of Tuesday’s close. The negative short-term trend is showing signs of shifting as double bottom support around 5700 is carved out. Despite the recent stall, this market is not showing any broader topping setups and there remains greater evidence of support than resistance over an intermediate-term timeframe, presenting characteristics of a bullish trend that remains enticing for the positive seasonal tendencies ahead. The concern to the prevailing path, however, is the waning of upside momentum with MACD negatively diverging from price since the end of last year, highlighting the fading enthusiasm towards the risk profile that equities encompass. The short-term pullback has provided us with an entry point to the strength that is normal of the equity market through the last couple of months of the year. We continue to like the groups that are on our list of Accumulate candidates, but there are certainly segments of the market to Avoid. With the start of the best six months of the year for stocks getting underway, our risk exposure is ramping up and we will be seeking evidence of the alleviation volatility/fear metrics (eg. the VIX) from their rising paths through the days ahead.
Today, in our Market Outlook to subscribers, we discuss the following:
- The jump in Chinese equities on US Election Day
- Emerging Market stocks
- US Vehicle Sales and the weak trend of heavy truck purchases
- US Factory Orders and the investment implications within
Subscribers can look for this report in their inbox or by clicking on the following link and logging in: Market Outlook for November 6
Not signed up yet? Subscribe now to receive full access to all of the research and analysis that we publish.
Sentiment on Tuesday, as gauged by the put-call ratio, ended Neutral at 0.99.
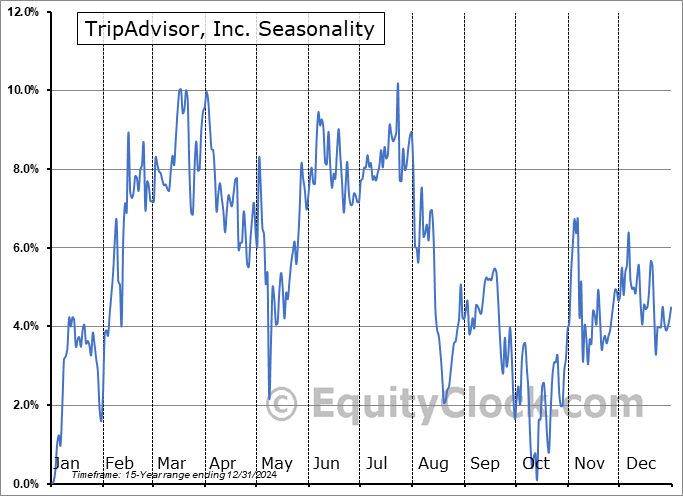
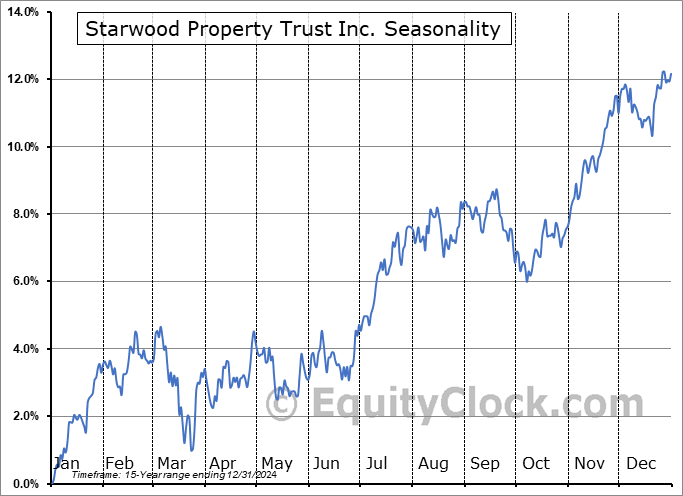
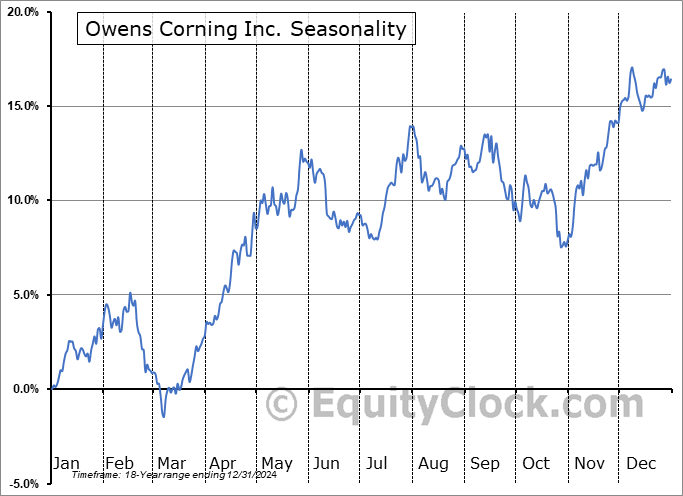
Seasonal charts of companies reporting earnings today:
S&P 500 Index
TSE Composite
| Sponsored By... |

|


