Stock Market Outlook for November 8, 2024

The fundamentals surrounding the Agriculture are failing to present a backdrop that is enticing to the seasonal trade in the industry through the end of the year.
*** Stocks highlighted are for information purposes only and should not be considered as advice to purchase or to sell mentioned securities. As always, the use of technical and fundamental analysis is encouraged in order to fine tune entry and exit points to average seasonal trends.
Stocks Entering Period of Seasonal Strength Today:
Subscribers Click on the relevant link to view the full profile. Not a subscriber? Signup here.
iShares Mortgage Real Estate Capped ETF (NYSE:REM) Seasonal Chart
iShares MSCI Europe IMI Index ETF (TSE:XEU.TO) Seasonal Chart
SPDR SSGA Global Allocation ETF (AMEX:GAL) Seasonal Chart
Maui Land & Pineapple Co., Inc. (NYSE:MLP) Seasonal Chart
Vanguard S&P 500 Value ETF (NYSE:VOOV) Seasonal Chart
Schwab International Equity ETF (NYSE:SCHF) Seasonal Chart
VanEck Vectors Pharmaceutical ETF (NASD:PPH) Seasonal Chart
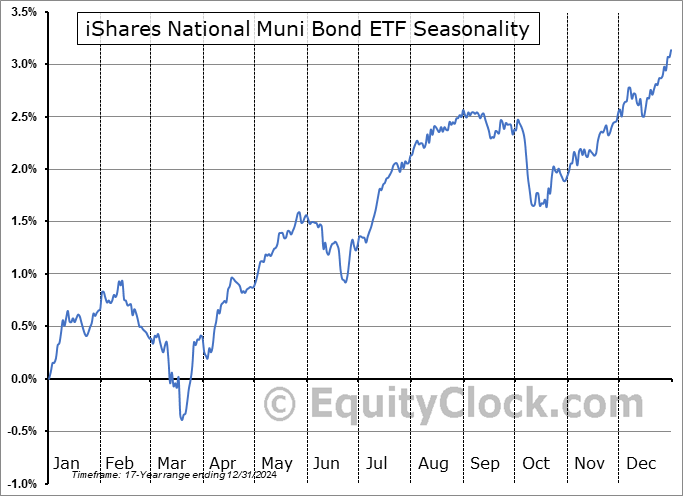
iShares National Muni Bond ETF (NYSE:MUB) Seasonal Chart
Invesco KBW Premium Yield Equity REIT ETF (NASD:KBWY) Seasonal Chart
iShares U.S. Healthcare ETF (NYSE:IYH) Seasonal Chart
Vanguard Total Corporate Bond ETF (NASD:VTC) Seasonal Chart
Flexsteel Industries, Inc. (NASD:FLXS) Seasonal Chart
Barclays Plc (NYSE:BCS) Seasonal Chart
Total Energy Services Inc. (TSE:TOT.TO) Seasonal Chart
TC Energy Corporation (TSE:TRP.TO) Seasonal Chart
Kinder Morgan Inc. (NYSE:KMI) Seasonal Chart
Abercrombie & Fitch Co. (NYSE:ANF) Seasonal Chart
iShares MSCI Japan ETF (NYSE:EWJ) Seasonal Chart
Vanguard Long-Term Bond ETF (NYSE:BLV) Seasonal Chart
iShares Canadian Government Bond Index ETF (TSE:XGB.TO) Seasonal Chart
iShares Canadian Corporate Bond Index ETF (TSE:XCB.TO) Seasonal Chart
The Markets
Stocks continued to drift higher on Thursday as traders invest on the belief that Tuesday’s Republican sweep will fuel a pro-growth economic backdrop in 2025. The S&P 500 Index closed higher by just less than three-quarters of one percent, continuing to move above support at the 50-day average (5720) that was tested at the start of the week. Gap support remains unfilled between Tuesday’s close at 5783 and Wednesday’s open at 5864. On a intermediate-term scale, there remains greater evidence of support than resistance, presenting characteristics of a bullish trend that remains enticing for the strength that is normally realized in the market at year-end. MACD has curled higher above its middle line following the rebound in the past three days, reconfirming characteristics of a bullish trend. The short-term pullback realized at the end of October and into the start of November provided us with an entry point to risk exposure for the strength that is normal of the equity market through the last couple of months of the year and we are now locked into the risk exposure that we desire for this timeframe. We continue to like how our list of candidates in the market to Accumulate and to Avoid is positioned and we will be scrutinizing whether any changes are required in the days/weeks ahead as the price action evolves.
Today, in our Market Outlook to subscribers, we discuss the following:
- Weekly Jobless Claims and the health of the labor market
- Natural Gas inventories and the seasonal trade in the commodity
- US Wholesale Trade
- The poor fundamental backdrop for the seasonal trade in the Agriculture industry
- The strength in technology and pharmaceutical wholesale sales
Subscribers can look for this report in their inbox or by clicking on the following link and logging in: Market Outlook for November 8
Not signed up yet? Subscribe now to receive full access to all of the research and analysis that we publish.
Sentiment on Thursday, as gauged by the put-call ratio, ended bullish at 0.83.
Seasonal charts of companies reporting earnings today:
S&P 500 Index
TSE Composite
| Sponsored By... |

|


