Stock Market Outlook for November 11, 2024

The MSCI World ex-US Index has gone nowhere since 2007 as investors remain hinged solely on domestic (US) stocks.
*** Stocks highlighted are for information purposes only and should not be considered as advice to purchase or to sell mentioned securities. As always, the use of technical and fundamental analysis is encouraged in order to fine tune entry and exit points to average seasonal trends.
Stocks Entering Period of Seasonal Strength Today:
Subscribers Click on the relevant link to view the full profile. Not a subscriber? Signup here.
Franklin Universal Trust (NYSE:FT) Seasonal Chart
Invesco Dynamic Building & Construction ETF (NYSE:PKB) Seasonal Chart
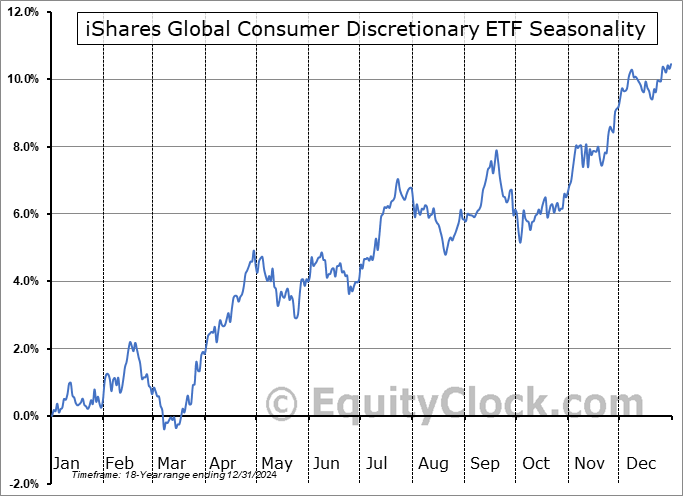
iShares Global Consumer Discretionary ETF (NYSE:RXI) Seasonal Chart
Vanguard Russell 2000 Growth ETF (NASD:VTWG) Seasonal Chart
Fortune Brands Innovations, Inc. (NYSE:FBIN) Seasonal Chart
Lowes Companies, Inc. (NYSE:LOW) Seasonal Chart
Church & Dwight Co, Inc. (NYSE:CHD) Seasonal Chart
The J. M. Smucker Co. (NYSE:SJM) Seasonal Chart
Morguard Real Estate Investment Trust (TSE:MRT/UN.TO) Seasonal Chart
VanEck Vectors Agribusiness ETF (NYSE:MOO) Seasonal Chart
iShares 10-20 Year Treasury Bond ETF (NYSE:TLH) Seasonal Chart
Invesco Municipal Trust (NYSE:VKQ) Seasonal Chart
Vanguard Russell 1000 ETF (NASD:VONE) Seasonal Chart
Advanced Micro Devices, Inc. (NASD:AMD) Seasonal Chart
Maple Leaf Foods, Inc. (TSE:MFI.TO) Seasonal Chart
Packaging Corp Of America (NYSE:PKG) Seasonal Chart
Spectrum Brands Inc. (NYSE:SPB) Seasonal Chart
GoDaddy Inc. (NYSE:GDDY) Seasonal Chart
Renaissance International IPO ETF (AMEX:IPOS) Seasonal Chart
iShares U.S. Consumer Goods ETF (NYSE:IYK) Seasonal Chart
Health Care Select Sector SPDR Fund (NYSE:XLV) Seasonal Chart
Vanguard Total World Bond ETF (NASD:BNDW) Seasonal Chart
BMO Corporate Bond Index ETF (TSE:ZCB.TO) Seasonal Chart
BMO Low Volatility US Equity ETF (TSE:ZLU.TO) Seasonal Chart
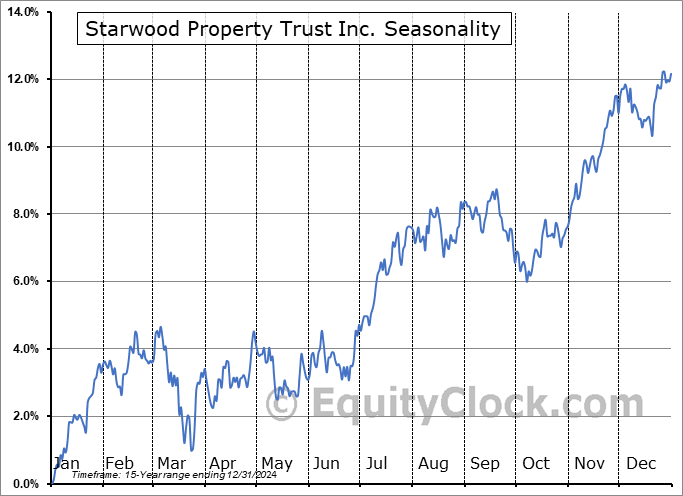
Starwood Property Trust Inc. (NYSE:STWD) Seasonal Chart
Riocan Real Estate Investment Trust (TSE:REI/UN.TO) Seasonal Chart
Cardinal Health, Inc. (NYSE:CAH) Seasonal Chart
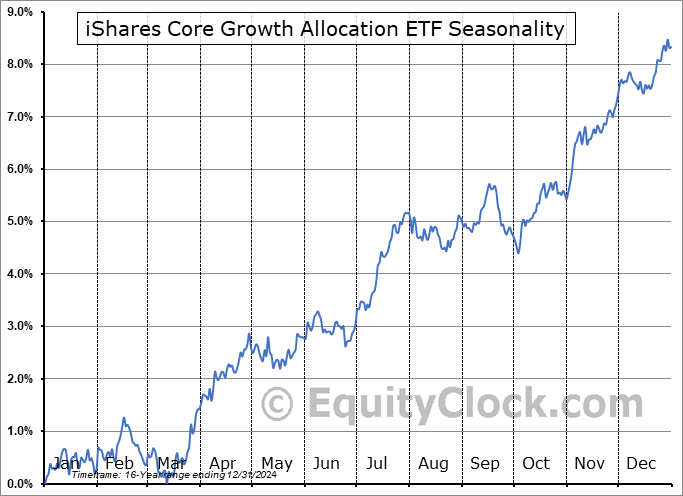
iShares Core Growth Allocation ETF (NYSE:AOR) Seasonal Chart
iShares MSCI Mexico Capped ETF (NYSE:EWW) Seasonal Chart
The Markets
Stocks continued to receive lift on Friday as traders invest on the belief that Tuesday’s Republican sweep will fuel a pro-growth economic backdrop in 2025. The S&P 500 Index gained just less than four-tenths of one percent, knocking on the door of an important psychological threshold and the year-end target of many analysts at 6000. Gap support remains unfilled between Tuesday’s close at 5783 and Wednesday’s open at 5864. On a intermediate-term scale, there remains greater evidence of support than resistance, presenting characteristics of a bullish trend that remains enticing for the strength that is normally realized in the market at year-end. MACD has curled higher above its middle line following the rebound in the past four days, reconfirming characteristics of a bullish trend. The short-term pullback realized at the end of October and into the start of November provided us with an entry point to risk exposure for the strength that is normal of the equity market through the last couple of months of the year and we are now locked into the risk exposure that we desire for this timeframe. We continue to like how our list of candidates in the market to Accumulate and to Avoid is positioned and we will be scrutinizing whether any changes are required in the days/weeks ahead as the price action evolves.
Today, in our Market Outlook to subscribers, we discuss the following:
- Weekly look at the large-cap benchmark
- Stocks outside of the US remain stuck in an underperforming trend versus equities in the US
- Canada Labour Force Survey and the investment implications within
- The rise in Canada’s population
- Canadian Unemployment
Subscribers can look for this report in their inbox or by clicking on the following link and logging in: Market Outlook for November 11
Not signed up yet? Subscribe now to receive full access to all of the research and analysis that we publish.
Sentiment on Friday, as gauged by the put-call ratio, ended bullish at 0.82.
Seasonal charts of companies reporting earnings today:
S&P 500 Index
TSE Composite
| Sponsored By... |

|


