Stock Market Outlook for November 12, 2024

A pro-cyclical bent has been unleashed.
*** Stocks highlighted are for information purposes only and should not be considered as advice to purchase or to sell mentioned securities. As always, the use of technical and fundamental analysis is encouraged in order to fine tune entry and exit points to average seasonal trends.
Stocks Entering Period of Seasonal Strength Today:
Subscribers Click on the relevant link to view the full profile. Not a subscriber? Signup here.
Olympia Financial Group Inc. (TSE:OLY.TO) Seasonal Chart
MediaValet Inc. (TSE:MVP.TO) Seasonal Chart
iShares Latin America 40 ETF (NYSE:ILF) Seasonal Chart
John Hancock Hedged Equity & Income Fund (NYSE:HEQ) Seasonal Chart
BMO Long Provincial Bond Index ETF (TSE:ZPL.TO) Seasonal Chart
Ocular Therapeutix Inc. (NASD:OCUL) Seasonal Chart
National Fuel Gas Co. (NYSE:NFG) Seasonal Chart
Jones Lang Lasalle, Inc. (NYSE:JLL) Seasonal Chart
Public Service Enterprise (NYSE:PEG) Seasonal Chart
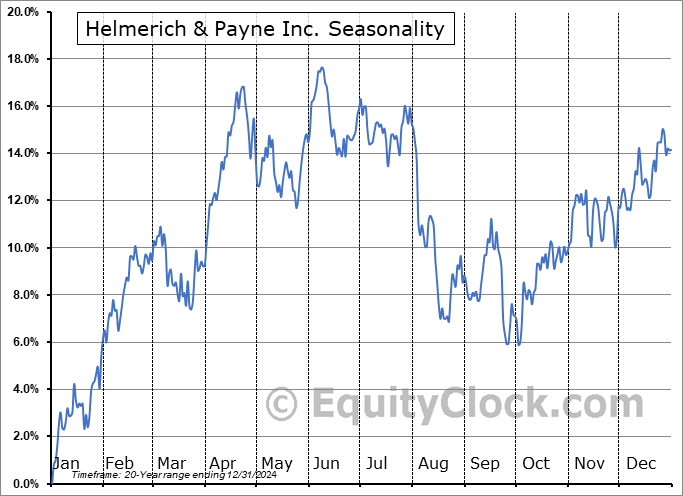
Helmerich & Payne Inc. (NYSE:HP) Seasonal Chart
Hologic, Inc. (NASD:HOLX) Seasonal Chart
Eversource Energy (NYSE:ES) Seasonal Chart
Sonoco Products Co. (NYSE:SON) Seasonal Chart
CMS Energy Corp. (NYSE:CMS) Seasonal Chart
The Markets
The election induced momentum jolt in the equity market continues. The S&P 500 Index gained a tenth of one percent, pushing marginally above the important psychological threshold and the year-end target of many analysts at 6000. Gap support remains unfilled between Tuesday’s close at 5783 and Wednesday’s open at 5864. On a intermediate-term scale, there remains greater evidence of support than resistance, presenting characteristics of a bullish trend that remains enticing for the strength that is normally realized in the market at year-end. MACD has curled higher above its middle line following the rebound in the past five days, reconfirming characteristics of a bullish trend. The short-term pullback realized at the end of October and into the start of November provided us with an entry point to risk exposure for the strength that is normal of the equity market through the last couple of months of the year and we are now locked into the risk exposure that we desire for this timeframe. We continue to like how our list of candidates in the market to Accumulate and to Avoid is positioned and we will be scrutinizing whether any changes are required in the days/weeks ahead as the price action evolves.
Want to know which areas of the market to buy or sell? Our Weekly Chart Books have just been updated, providing a clear Accumulate, Avoid, or Neutral rating for currencies, cryptocurrencies, commodities, broad markets, and subsectors/industries of the market. Subscribers can login and click on the relevant links to access.
- Currencies
- Cryptocurrencies
- Commodities
- Major Benchmarks
- Sub-sectors / Industries
- ETFs: Bonds | Commodities | Equity Markets | Industries | Sectors
Subscribe now.
Today, in our Market Outlook to subscribers, we discuss the following:
- Our weekly charts books update, along with our list of all segments of the market to either Accumulate or Avoid
- Other Notes
- Investor Sentiment
Subscribers can look for this report in their inbox or by clicking on the following link and logging in: Market Outlook for November 12
Not signed up yet? Subscribe now to receive full access to all of the research and analysis that we publish.
Sentiment on Monday, as gauged by the put-call ratio, ended overly bullish at 0.70.
Seasonal charts of companies reporting earnings today:
S&P 500 Index
TSE Composite
| Sponsored By... |

|


