Stock Market Outlook for November 19, 2024

While the setup for stocks is positive for the year-end seasonal strength, investors should be prepared for the fading of enthusiasm once the new president takes office.
*** Stocks highlighted are for information purposes only and should not be considered as advice to purchase or to sell mentioned securities. As always, the use of technical and fundamental analysis is encouraged in order to fine tune entry and exit points to average seasonal trends.
Stocks Entering Period of Seasonal Strength Today:
Subscribers Click on the relevant link to view the full profile. Not a subscriber? Signup here.
Moelis & Co. (NYSE:MC) Seasonal Chart
Orion Engineered Carbons SA (NYSE:OEC) Seasonal Chart
iShares S&P Small-Cap 600 Value ETF (NYSE:IJS) Seasonal Chart
iShares Micro-Cap ETF (NYSE:IWC) Seasonal Chart
iShares U.S. Telecommunications ETF (NYSE:IYZ) Seasonal Chart
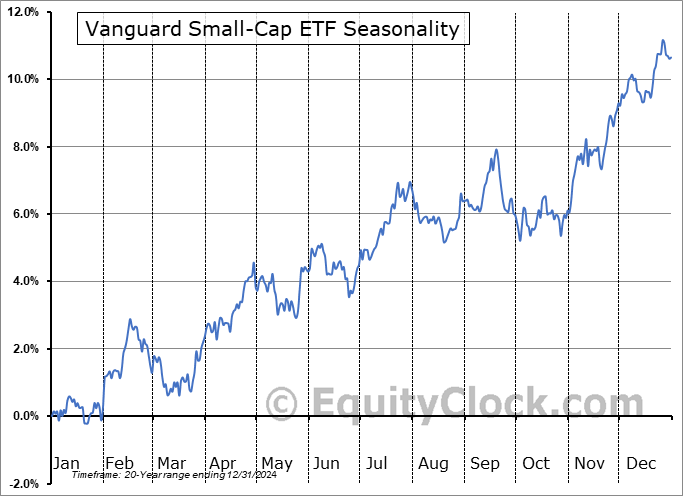
Vanguard Small-Cap ETF (NYSE:VB) Seasonal Chart
Invesco S&P MidCap Value with Momentum ETF (AMEX:XMVM) Seasonal Chart
Cardlytics, Inc. (NASD:CDLX) Seasonal Chart
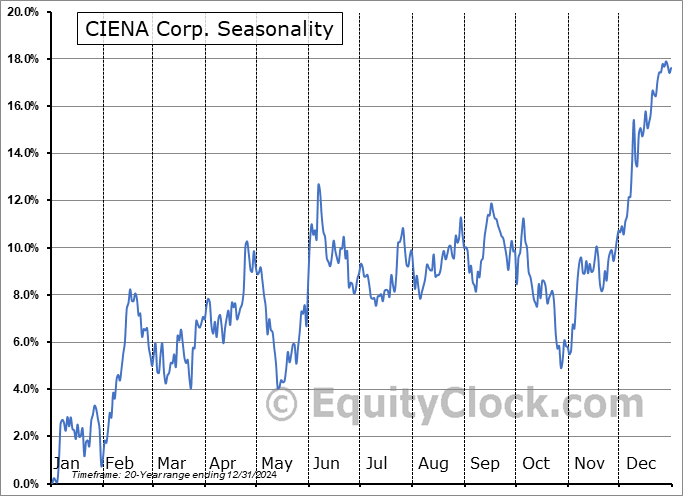
CIENA Corp. (NYSE:CIEN) Seasonal Chart
Boyd Gaming Corp. (NYSE:BYD) Seasonal Chart
Wynn Resorts Ltd (NASD:WYNN) Seasonal Chart
Skyworks Solutions Inc. (NASD:SWKS) Seasonal Chart
BorgWarner, Inc. (NYSE:BWA) Seasonal Chart
Mohawk Inds, Inc. (NYSE:MHK) Seasonal Chart
Omega Healthcare Invs, Inc. (NYSE:OHI) Seasonal Chart
Terex Corp. (NYSE:TEX) Seasonal Chart
Titan Intl, Inc. (NYSE:TWI) Seasonal Chart
Olympic Steel, Inc. (NASD:ZEUS) Seasonal Chart
Canadian Solar Inc. (NASD:CSIQ) Seasonal Chart
Allegheny Technologies (NYSE:ATI) Seasonal Chart
Builders FirstSource, Inc. (NYSE:BLDR) Seasonal Chart
Booking Holdings Inc. (NASD:BKNG) Seasonal Chart
The Markets
Stocks ticked higher to start the week as dollar and rate headwinds took a breather. The S&P 500 Index closed higher by nearly four-tenths of one percent, finding support at the 20-day moving average (5862), along with gap support that was opened almost two weeks ago between 5783 and 5864, a zone that was reasonable to be filled before the march higher aligned with seasonal norms continues around the US Thanksgiving holiday. On a intermediate-term scale, there remains greater evidence of support than resistance, presenting characteristics of a bullish trend that remains enticing for the strength that is normally realized in the market at year-end. We continue to like how our list of candidates in the market to Accumulate and to Avoid is positioned, but we are cognizant of changing market dynamics as revelations pertaining to Trump’s initiatives become apparent and as dollar/rate headwinds grow. We continue to scrutinize whether any changes are required in the days/weeks ahead as the price action evolves.
Want to know which areas of the market to buy or sell? Our Weekly Chart Books have just been updated, providing a clear Accumulate, Avoid, or Neutral rating for currencies, cryptocurrencies, commodities, broad markets, and subsectors/industries of the market. Subscribers can login and click on the relevant links to access.
- Currencies
- Cryptocurrencies
- Commodities
- Major Benchmarks
- Sub-sectors / Industries
- ETFs: Bonds | Commodities | Equity Markets | Industries | Sectors
Subscribe now.
Today, in our Market Outlook to subscribers, we discuss the following:
- Our weekly chart books update, along with our list of all segments of the market to either Accumulate or Avoid
- Other Notes
- Post-election year tendency for stocks and how the average performance varies when a new presidential party takes charge
Subscribers can look for this report in their inbox or by clicking on the following link and logging in: Market Outlook for November 19
Not signed up yet? Subscribe now to receive full access to all of the research and analysis that we publish.
Sentiment on Monday, as gauged by the put-call ratio, ended bullish at 0.78.
Seasonal charts of companies reporting earnings today:
S&P 500 Index
TSE Composite
| Sponsored By... |

|


