Stock Market Outlook for December 2, 2024

The last month of the year is typically one of the strongest periods for stocks with the S&P 500 Index gaining an average of 1.2%, based on data from the past five decades.
*** Stocks highlighted are for information purposes only and should not be considered as advice to purchase or to sell mentioned securities. As always, the use of technical and fundamental analysis is encouraged in order to fine tune entry and exit points to average seasonal trends.
Stocks Entering Period of Seasonal Strength Today:
Subscribers Click on the relevant link to view the full profile. Not a subscriber? Signup here.
Hershey Foods Corp. (NYSE:HSY) Seasonal Chart
Micron Technology, Inc. (NASD:MU) Seasonal Chart
Philip Morris Intl Inc. (NYSE:PM) Seasonal Chart
Capstone Copper Corp (TSE:CS.TO) Seasonal Chart
Northern Dynasty Minerals Ltd. (TSE:NDM.TO) Seasonal Chart
CONMED Corp. (NYSE:CNMD) Seasonal Chart
Amdocs Ltd. (NASD:DOX) Seasonal Chart
Prudential PLC (NYSE:PUK) Seasonal Chart
Sprott Physical Gold Silver Trust (TSE:CEF.TO) Seasonal Chart
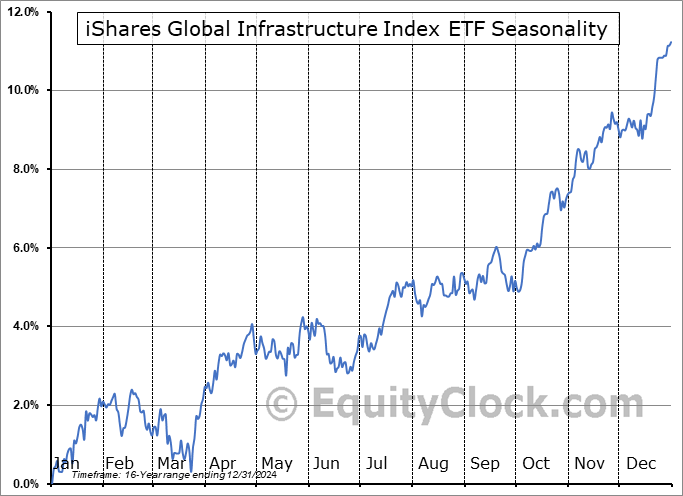
iShares Global Infrastructure Index ETF (TSE:CIF.TO) Seasonal Chart
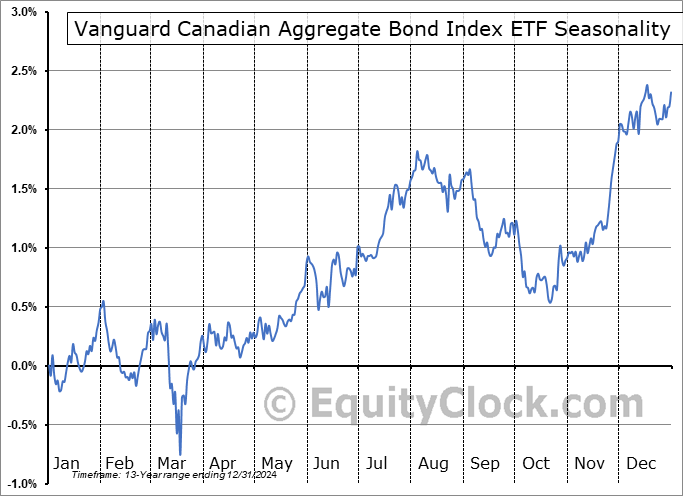
Vanguard Canadian Aggregate Bond Index ETF (TSE:VAB.TO) Seasonal Chart
iShares Core Aggressive Allocation ETF (NYSE:AOA) Seasonal Chart
iShares MSCI Europe Financials ETF (NASD:EUFN) Seasonal Chart
iShares Core MSCI Total International Stock ETF (NASD:IXUS) Seasonal Chart
SPDR MSCI World Quality Mix ETF (AMEX:QWLD) Seasonal Chart
Sprott Physical Gold Trust (TSE:PHYS.TO) Seasonal Chart
Sprott Physical Silver Trust (TSE:PSLV.TO) Seasonal Chart
iShares Core International Aggregate Bond ETF (AMEX:IAGG) Seasonal Chart
Real Estate Select Sector SPDR Fund (NYSE:XLRE) Seasonal Chart
Embraer Aircraft (NYSE:ERJ) Seasonal Chart
Cogent Communications Holdings, Inc. (NASD:CCOI) Seasonal Chart
Douglas Emmett Inc. (NYSE:DEI) Seasonal Chart
Zimmer Biomet Holdings, Inc. (NYSE:ZBH) Seasonal Chart
Ventas, Inc. (NYSE:VTR) Seasonal Chart
iShares Global Clean Energy ETF (NASD:ICLN) Seasonal Chart
Valero Energy Corp (NYSE:VLO) Seasonal Chart
iShares Core MSCI Emerging Markets IMI Index ETF (TSE:XEC.TO) Seasonal Chart
Vanguard Mid-Cap Growth ETF (NYSE:VOT) Seasonal Chart
Rayonier, Inc. (NYSE:RYN) Seasonal Chart
The Markets
Stocks moved higher in the last trading session of November as a reprieve of the recent weakness in the semiconductor industry helped to give lift to the Technology sector and benchmarks heavily weight to this market segment. The S&P 500 Index gained almost six-tenths of one percent, charting a fresh record closing high and continuing to hold above support at the 20-day moving average (5929). Price continues to hold above previous short-term declining trendline resistance that was formed by connecting the peaks since November 11th and a short-term path of higher-highs and higher-lows stemming from the November 19th double-bottom support at 5850 is in play. On a intermediate-term scale, there remains greater evidence of support than resistance, presenting the desired backdrop for strength that is normally realized in the market at year-end. Major moving averages are all pointed higher and momentum indicators continue to gyrate above their middle lines, providing characteristics of a bullish trend. Our list of candidates in the market to Accumulate and to Avoid remains well positioned to benefit from the strength that is filtering into the market at this seasonally strong time of year, but we will scrutinize whether any changes are required as the price action evolves.
Today, in our Market Outlook to subscribers, we discuss the following:
- Monthly look at the large-cap benchmark
- Average performance for the S&P 500 Index in December
- December tendencies during the two halves of the month and the Santa Claus rally
- Securities that have gained or lost in every December over their trading history
- Canada Gross Domestic Product (GDP) and the recessionary path that persists
- The optimal holding period for Gold Miners
- Medical Devices seasonal trade
Subscribers can look for this report in their inbox or by clicking on the following link and logging in: Market Outlook for December 2
Not signed up yet? Subscribe now to receive full access to all of the research and analysis that we publish.
For the month ahead, now a full month into the best six months of the year for stocks, December tends to continue the strong pace of monthly returns for equity benchmarks. The last month of the year is typically one of the strongest periods for stocks as end of quarter and end of year reallocations cause a drift higher in prices, particularly around the Christmas holiday, a period that has become known as the Santa Claus rally. Over the past five decades, the S&P 500 Index has averaged a return of 1.2% in this last month of the year with a frequency of gains for the month coming in at 72%. Returns have ranged from a loss of 9.2% in December of 2018 to a gain of 11.2% in December of 1991. Gains tend to be dominated by the last half of the month as investors jockey for position around the quarter/year-end. We break down everything that you need to know for the month(s) ahead in our just released Monthly Outlook for December. Subscribe now.
Just Released…
Our monthly report for December is out, providing you with everything that you need to know to navigate the market through the month(s) ahead.
Highlights in this report include:
- Equity market tendencies in the month of December
- Post-Election Tendency for stocks
- Bonds
- Interest Rate Sensitive Sectors
- Bullish Precious Metals and the Miners
- Time to consider inflation hedges for portfolios?
- Time to rotate to Canadian equities?
- Energy stocks set to energize portfolios this winter
- Small Caps a prime rotation candidate
- Unhealthy Health Care
- Retail Sales
- Discretionary spending not showing much vigor heading into the important consumer spending period in December
- Services over Goods
- Insurance setup well into year-end
- Industrial Production
- Manufacturers turning optimistic, at least in New York
- US Dollar
- Our list of all segments of the market to either Accumulate or Avoid, along with relevant ETFs
- Positioning for the months ahead
- Sector Reviews and Ratings
- Stocks that have Frequently Gained in the Month of December
- Notable Stocks and ETFs Entering their Period of Strength in December
Subscribers can look for this 129-page report in their inbox and, soon, in the report archive.
Not subscribed yet? Signup now to receive access to this report and all of the research that we publish.
With the new month upon us and as we celebrate the release of our monthly report for December, today we release our screen of all of the stocks that have gained in every December over their trading history. While we at Equity Clock focus on a three-pronged approach (seasonal, technical, and fundamental analysis) to gain exposure to areas of the market that typically perform well over intermediate (2 to 6 months) timeframes, we know that stocks that have a 100% frequency of success for a particular month is generally of interest to those pursuing a seasonal investment strategy. Below are the results:
And how about those securities that have never gained in this last month of the year, here they are:
*Note: None of the results highlighted above have the 20 years of data that we like to see in order to accurately gauge the annual recurring, seasonal influences impacting an investment, therefore the reliability of the results should be questioned. We present the above list as an example of how our downloadable spreadsheet available to yearly subscribers can be filtered.
Sentiment on Friday, as gauged by the put-call ratio, ended bullish at 0.88.
Seasonal charts of companies reporting earnings today:
S&P 500 Index
TSE Composite
| Sponsored By... |

|


