Stock Market Outlook for December 3, 2024

The health of the market through the last month of the year is expected to show a heavy reliance on yields and the dollar.
*** Stocks highlighted are for information purposes only and should not be considered as advice to purchase or to sell mentioned securities. As always, the use of technical and fundamental analysis is encouraged in order to fine tune entry and exit points to average seasonal trends.
Stocks Entering Period of Seasonal Strength Today:
Subscribers Click on the relevant link to view the full profile. Not a subscriber? Signup here.
Global X China Materials ETF (NYSE:CHIM) Seasonal Chart
Cantaloupe, Inc. (NASD:CTLP) Seasonal Chart
Boston Omaha Corp. (NYSE:BOC) Seasonal Chart
Teucrium Corn Fund (NYSE:CORN) Seasonal Chart
Innovator S&P 500 Power Buffer ETF (AMEX:PJUL) Seasonal Chart
Physicians Realty Trust (NYSE:DOC) Seasonal Chart
Denison Mines Corp. (TSE:DML.TO) Seasonal Chart
Canacol Energy Ltd. (TSE:CNE.TO) Seasonal Chart
LendingTree, Inc. (NASD:TREE) Seasonal Chart
NICE Ltd. (NASD:NICE) Seasonal Chart
Canfor Pulp Products Inc. (TSE:CFX.TO) Seasonal Chart
Agilysys Inc. (NASD:AGYS) Seasonal Chart
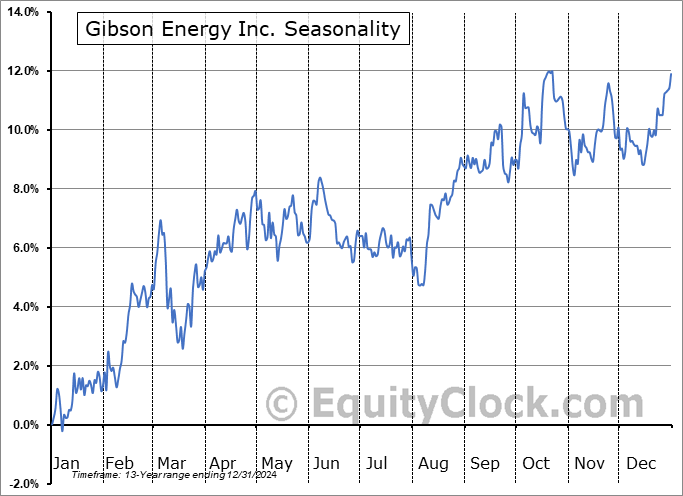
Gibson Energy Inc. (TSE:GEI.TO) Seasonal Chart
Freshpet Inc. (NASD:FRPT) Seasonal Chart
Invesco Water Resources ETF (NASD:PHO) Seasonal Chart
The Markets
Stocks edged higher in the first trading session of December as investors pushed back into growth stocks following the recent lag in Technology sector performance. The S&P 500 Index gained almost a quarter of one percent, charting a fresh record closing high and continuing to hold above support at the 20-day moving average (5945). Price has pushed above previous short-term declining trendline resistance that was formed by connecting the peaks since November 11th and a short-term path of higher-highs and higher-lows stemming from the November 19th double-bottom support at 5850 is in play. On a intermediate-term scale, there remains greater evidence of support than resistance, presenting the desired backdrop for strength that is normally realized in the market at year-end. Major moving averages are all pointed higher and momentum indicators continue to gyrate above their middle lines, providing characteristics of a bullish trend. Our list of candidates in the market to Accumulate and to Avoid remains well positioned to benefit from the strength that is filtering into the market at this seasonally strong time of year, but we will scrutinize whether any changes are required as the price action evolves.
Want to know which areas of the market to buy or sell? Our Weekly Chart Books have just been updated, providing a clear Accumulate, Avoid, or Neutral rating for currencies, cryptocurrencies, commodities, broad markets, and subsectors/industries of the market. Subscribers can login and click on the relevant links to access.
- Currencies
- Cryptocurrencies
- Commodities
- Major Benchmarks
- Sub-sectors / Industries
- ETFs: Bonds | Commodities | Equity Markets | Industries | Sectors
Subscribe now.
Today, in our Market Outlook to subscribers, we discuss the following:
- Our weekly chart books update, along with our list of all market segments to either Accumulate or to Avoid
- Other Notes
- Bond Prices bouncing from intermediate-term rising trendine support as a long-term bottoming pattern evolves
- Japanese Yen carving out a bottoming pattern, threatening another carry trade unwind
Subscribers can look for this report in their inbox or by clicking on the following link and logging in: Market Outlook for December 3
Not signed up yet? Subscribe now to receive full access to all of the research and analysis that we publish.
Sentiment on Monday, as gauged by the put-call ratio, ended bullish at 0.85.
Just Released…
Our monthly report for December is out, providing you with everything that you need to know to navigate the market through the month(s) ahead.
Highlights in this report include:
- Equity market tendencies in the month of December
- Post-Election Tendency for stocks
- Bonds
- Interest Rate Sensitive Sectors
- Bullish Precious Metals and the Miners
- Time to consider inflation hedges for portfolios?
- Time to rotate to Canadian equities?
- Energy stocks set to energize portfolios this winter
- Small Caps a prime rotation candidate
- Unhealthy Health Care
- Retail Sales
- Discretionary spending not showing much vigor heading into the important consumer spending period in December
- Services over Goods
- Insurance setup well into year-end
- Industrial Production
- Manufacturers turning optimistic, at least in New York
- US Dollar
- Our list of all segments of the market to either Accumulate or Avoid, along with relevant ETFs
- Positioning for the months ahead
- Sector Reviews and Ratings
- Stocks that have Frequently Gained in the Month of December
- Notable Stocks and ETFs Entering their Period of Strength in December
Subscribers can look for this 129-page report in their inbox and in the report archive.
Not subscribed yet? Signup now to receive access to this report and all of the research that we publish.
Seasonal charts of companies reporting earnings today:
S&P 500 Index
TSE Composite
| Sponsored By... |

|


