Stock Market Outlook for December 9, 2024

The second largest surge in Canadian unemployment in the past four decades highlights a labour market that is struggling.
*** Stocks highlighted are for information purposes only and should not be considered as advice to purchase or to sell mentioned securities. As always, the use of technical and fundamental analysis is encouraged in order to fine tune entry and exit points to average seasonal trends.
Stocks Entering Period of Seasonal Strength Today:
Subscribers Click on the relevant link to view the full profile. Not a subscriber? Signup here.
Invesco DB Agriculture Fund (NYSE:DBA) Seasonal Chart
TWC Enterprises Limited (TSE:TWC.TO) Seasonal Chart
Baxter Intl Inc. (NYSE:BAX) Seasonal Chart
Brookfield Renewable Energy Partners LP (TSE:BEP/UN.TO) Seasonal Chart
Quebecor, Inc. (TSE:QBR/B.TO) Seasonal Chart
Melcor Developments Ltd. (TSE:MRD.TO) Seasonal Chart
Estee Lauder Cos. (NYSE:EL) Seasonal Chart
Hess Corp. (NYSE:HES) Seasonal Chart
Toronto-Dominion Bank (TSE:TD.TO) Seasonal Chart
Plains All American Pipeline, LP (NASD:PAA) Seasonal Chart
Americas Silver Corp. (TSE:USA.TO) Seasonal Chart
iShares Global Energy ETF (NYSE:IXC) Seasonal Chart
Vanguard Total International Stock ETF (NASD:VXUS) Seasonal Chart
ShawCor Ltd. (TSE:MATR.TO) Seasonal Chart
Energy Select Sector SPDR Fund (NYSE:XLE) Seasonal Chart
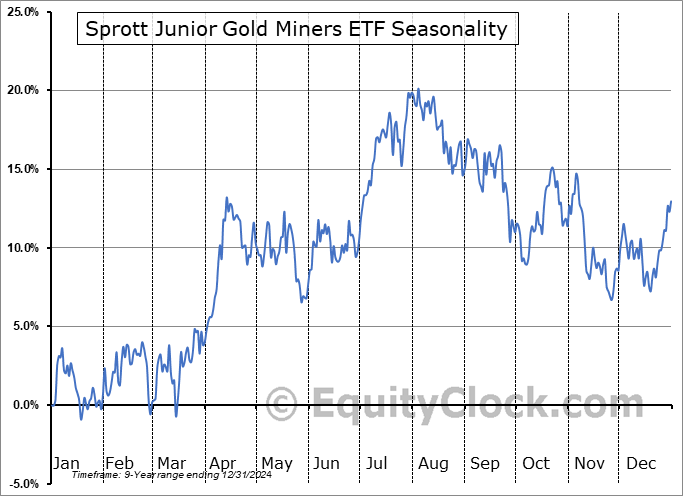
Sprott Junior Gold Miners ETF (AMEX:SGDJ) Seasonal Chart
abrdn Physical Platinum Shares ETF (NYSE:PPLT) Seasonal Chart
iShares Currency Hedged MSCI Emerging Markets ETF (AMEX:HEEM) Seasonal Chart
BMO S&P/TSX Capped Composite Index ETF (TSE:ZCN.TO) Seasonal Chart
Constellation Software Inc. (TSE:CSU.TO) Seasonal Chart
Premium Brands Holdings Corp. (TSE:PBH.TO) Seasonal Chart
iShares S&P/TSX Capped REIT Index ETF (TSE:XRE.TO) Seasonal Chart
Gold Fields Ltd. (NYSE:GFI) Seasonal Chart
Ensign Energy Services, Inc. (TSE:ESI.TO) Seasonal Chart
CAE, Inc. (TSE:CAE.TO) Seasonal Chart
The Markets
Stocks edged higher on Friday as a fairly middle-ground employment report in the US kept the prospect of a rate cut at the Fed’s next meeting intact. The S&P 500 Index gained a quarter of one percent, achieving yet another record closing high. Support continues at the 20-day moving average (5991). A sideways drift has developed in the past day following a break of short-term rising trendline support that stemmed from the November 19th double-bottom low at 5850, however, a trend of higher-highs and higher-lows remains; the 20-hour moving average is currently holding up the benchmark on an ultra-short-term scale. On a intermediate-term basis, there remains greater evidence of support than resistance, presenting the desired backdrop for strength that is normally realized in the market at year-end. Major moving averages are all pointed higher and momentum indicators continue to gyrate above their middle lines, providing characteristics of a bullish trend. Our list of candidates in the market to Accumulate and to Avoid remains well positioned to benefit from the strength that is filtering into the market at this seasonally strong time of year, but we will scrutinize whether any changes are required as the price action evolves.
Today, in our Market Outlook to subscribers, we discuss the following:
- Weekly look at the large-cap benchmark
- US Employment Situation and the investment implications within
- The eerily stagnant trend of wages in the past few months
- Canada Labour Force Survey and the investment implications within
- The second largest rise in Canadian unemployment in the past four decades
Subscribers can look for this report in their inbox or by clicking on the following link and logging in: Market Outlook for December 9
Not signed up yet? Subscribe now to receive full access to all of the research and analysis that we publish.
Sentiment on Friday, as gauged by the put-call ratio, ended bullish at 0.85.
Seasonal charts of companies reporting earnings today:
S&P 500 Index
TSE Composite
| Sponsored By... |

|


