Stock Market Outlook for December 20, 2024

The trend of loan activity remains highly depressed as consumers refrain from taking on high cost debt to finance real estate and automobile purchases.
*** Stocks highlighted are for information purposes only and should not be considered as advice to purchase or to sell mentioned securities. As always, the use of technical and fundamental analysis is encouraged in order to fine tune entry and exit points to average seasonal trends.
Stocks Entering Period of Seasonal Strength Today:
Subscribers Click on the relevant link to view the full profile. Not a subscriber? Signup here.
TNR Gold Corp. (TSXV:TNR.V) Seasonal Chart
CM Finance Inc. (NASD:ICMB) Seasonal Chart
Nicola Mining Inc. (TSXV:NIM.V) Seasonal Chart
Eguana Technologies Inc. (TSXV:EGT.V) Seasonal Chart
Cyanotech Corp. (NASD:CYAN) Seasonal Chart
Village Farms International, Inc. (NASD:VFF) Seasonal Chart
iShares MSCI China Small-Cap ETF (NYSE:ECNS) Seasonal Chart
Invesco China Technology ETF (NYSE:CQQQ) Seasonal Chart
Ares Management, LP (NYSE:ARES) Seasonal Chart
Enthusiast Gaming Holdings, Inc. (TSE:EGLX.TO) Seasonal Chart
Imunon, Inc. (NASD:IMNN) Seasonal Chart
INNOVATE Corp. (NYSE:VATE) Seasonal Chart
Global Ship Lease, Inc. (NYSE:GSL) Seasonal Chart
StealthGas (NASD:GASS) Seasonal Chart
Olin Corp. (NYSE:OLN) Seasonal Chart
Enterprise Products Partn (NYSE:EPD) Seasonal Chart
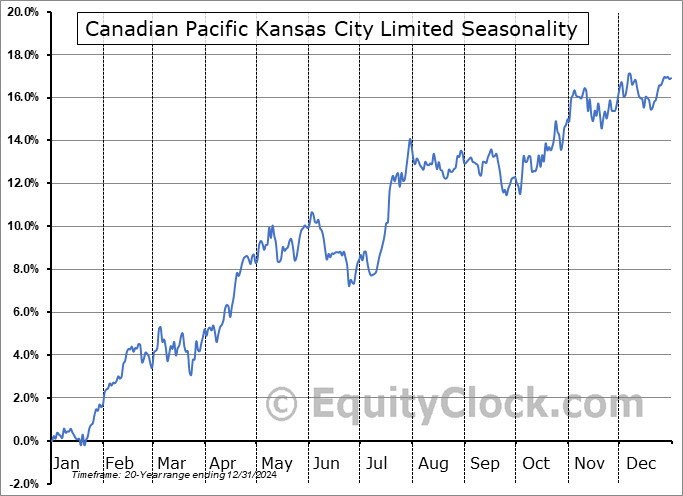
Canadian Pacific Kansas City Limited (NYSE:CP) Seasonal Chart
Ballard Power Systems, Inc. (TSE:BLDP.TO) Seasonal Chart
Corby Spirit and Wine Limited (TSE:CSW/B.TO) Seasonal Chart
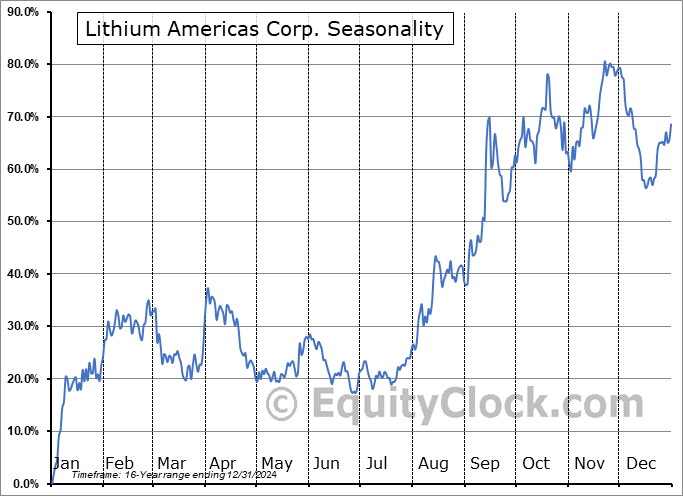
Lithium Americas Corp. (NYSE:LAC) Seasonal Chart
The Markets
Stocks struggled to gain traction on Thursday following the abrupt selloff that was triggered upon the conclusion of the FOMC meeting on Wednesday. The S&P 500 Index ended down by just less than a tenth of one percent, struggling below previous support, now resistance, at the 50-day moving average (5924). The benchmark is back to the previous level of support that was confirmed in November at the open gap that was charted following the US Election at 5850. While we will be looking for this point as the propping level for a rebound into the holiday period ahead, the “flagging” of price following the sharply negative candlesticks charted during the last two hours of trade on Wednesday has more of a short-term bearish appearance than something to be constructive of. On a intermediate-term basis, while the trend remains that of higher-highs and higher-lows, the first sign that the 50-day moving average has been unable to stem the tide of selling pressures certainly is sufficient to raise concern. Major moving averages continue to show rising parallel paths and momentum indicators continue to gyrate predominantly above their middle lines, providing characteristics of a bullish trend that warrants a positive positive bias, for now. Should we start to see major moving averages act as points of resistance, reason to conclude the shift of trend would be provided. Our list of candidates in the market to Accumulate and to Avoid remains appropriately positioned at this seasonally strong time of year, but our Avoid list has been growing in recent weeks given the fading of the election euphoria in the market.
Today, in our Market Outlook to subscribers, we discuss the following:
- US Existing Home Sales
- US Housing Starts
- The seasonal trade in the homebuilding industry
- The weak trend of consumer loan activity
- Home equity lines of credit showing the strongest rise since 2009
- Delinquencies on consumer debt
- Weekly jobless claims and the health of the labor market
Subscribers can look for this report in their inbox or by clicking on the following link and logging in: Market Outlook for December 20
Not signed up yet? Subscribe now to receive full access to all of the research and analysis that we publish.
Sentiment on Thursday, as gauged by the put-call ratio, ended bearish at 1.05.
Seasonal charts of companies reporting earnings today:
S&P 500 Index
TSE Composite
| Sponsored By... |

|


