Stock Market Outlook for January 13, 2025

Stronger than average reads of employment are pressuring yields and the dollar higher, resulting in a head-and-shoulders topping pattern on the chart of the S&P 500 Index.
*** Stocks highlighted are for information purposes only and should not be considered as advice to purchase or to sell mentioned securities. As always, the use of technical and fundamental analysis is encouraged in order to fine tune entry and exit points to average seasonal trends.
Stocks Entering Period of Seasonal Strength Today:
Subscribers Click on the relevant link to view the full profile. Not a subscriber? Signup here.

Colgate-Palmolive Co. (NYSE:CL) Seasonal Chart

Birchcliff Energy Limited (TSE:BIR.TO) Seasonal Chart

Inter Parfums, Inc. (NASD:IPAR) Seasonal Chart

Veren Inc. (TSE:VRN.TO) Seasonal Chart

United States Oil Fund, LP (NYSE:USO) Seasonal Chart

BMO Low Volatility Canadian Equity ETF (TSE:ZLB.TO) Seasonal Chart
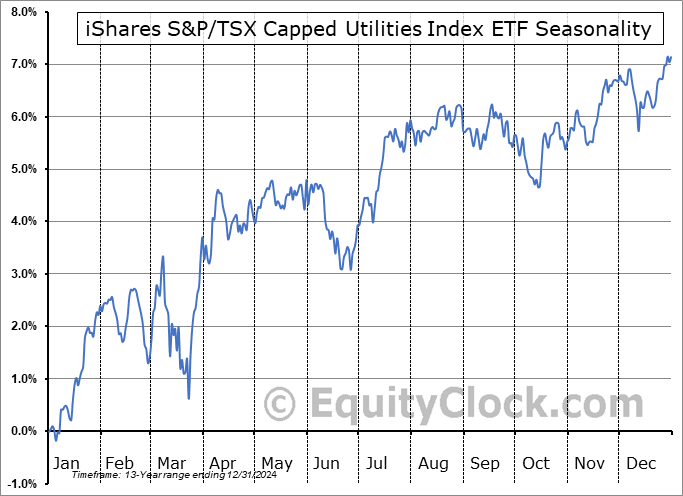
iShares S&P/TSX Capped Utilities Index ETF (TSE:XUT.TO) Seasonal Chart

Keurig Dr Pepper Inc. (NASD:KDP) Seasonal Chart

Pembina Pipeline Corp. (NYSE:PBA) Seasonal Chart

Radiant Logistics Inc. (AMEX:RLGT) Seasonal Chart

Digital Realty Trust, Inc. (NYSE:DLR) Seasonal Chart

CCL Industries Inc. – Class B (TSE:CCL/B.TO) Seasonal Chart

Canadian Utilities Ltd. (TSE:CU.TO) Seasonal Chart

Brown-Forman Corp. – Class B (NYSE:BF/B) Seasonal Chart

Akamai Technologies, Inc. (NASD:AKAM) Seasonal Chart

Nisource, Inc. (NYSE:NI) Seasonal Chart

Kirby Corp. (NYSE:KEX) Seasonal Chart

Monolithic Power Systems, Inc. (NASD:MPWR) Seasonal Chart

BMO Global Infrastructure Index ETF (TSE:ZGI.TO) Seasonal Chart
The Markets
Stocks traded firmly lower on Friday as a stronger than expected read of employment stoked inflationary concerns for the economy, thereby diminishing the prospect of a pullback in the cost of borrowing ahead. The S&P 500 Index dropped by 1.54% on Friday, showing ongoing reaction to resistance at the 20-day moving average (5961). The benchmark is now firmly below the 50-day moving average (5952), disconnecting from the neutral position in the context of the intermediate-term trend. A break of horizontal support at 5850 has been recorded, violating the neckline to a head-and-shoulders topping pattern that proposes a downside target of 5670. Superseding any patterns that can be picked out is just the mere appearance that resistance, such as around the 20-day moving average, is starting to have a greater influence than support. Reason to conclude the shift of trend has been provided. We continue to scrutinize the potential impact of this evolving shift on our list of candidates in the market to Accumulate and to Avoid and we are expecting that our list of candidates in the market to Avoid will expand following this first full week of the year now that start of the year fund inflows have been allocated.


Today, in our Market Outlook to subscribers, we discuss the following:
- Weekly look at the large-cap benchmark
- The rise in Yields and the US Dollar
- US Employment Situation and the investment implications within
- The jump in wages to end 2024 and the breakout on an important inflation gauge
- Canada Labour Force Survey and the investment implications within
- The largest rise in Canadian unemployment for a non-recessionary period in the past three decades
Subscribers can look for this report in their inbox or by clicking on the following link and logging in: Market Outlook for January 13
Not signed up yet? Subscribe now to receive full access to all of the research and analysis that we publish.
Sentiment on Friday, as gauged by the put-call ratio, ended neutral at 1.00.

Seasonal charts of companies reporting earnings today:


S&P 500 Index


TSE Composite


| Sponsored By... |

|


