Stock Market Outlook for February 11, 2025

The technicals and seasonal tendencies are not providing the purview to be as aggressive in stocks as what was allowable previous, but there are still plenty of things to buy.
*** Stocks highlighted are for information purposes only and should not be considered as advice to purchase or to sell mentioned securities. As always, the use of technical and fundamental analysis is encouraged in order to fine tune entry and exit points to average seasonal trends.
Stocks Entering Period of Seasonal Strength Today:
Subscribers Click on the relevant link to view the full profile. Not a subscriber? Signup here.
Air Products and Chemicals, Inc. (NYSE:APD) Seasonal Chart
Pearson PLC (NYSE:PSO) Seasonal Chart
Banco Santiago (NYSE:BSAC) Seasonal Chart
Cna Financial Corp. (NYSE:CNA) Seasonal Chart
WisdomTree Europe Hedged Equity Fund (NYSE:HEDJ) Seasonal Chart
Tsakos Energy Navigation Limited (NYSE:TEN) Seasonal Chart
The Markets
Stocks closed up on Monday, shaking off concerns pertaining to an escalation of a tariff war following news over the weekend that Donald Trump will implement a 25% tax on steel and aluminum imports coming into the US, as well as reciprocal tariffs on goods from other countries that have implemented this restrictive trade measure. The S&P 500 Index gained by two-thirds of one percent, continuing to gyrate above support at the 20-day moving average (~6020). The benchmark remains below a short-term cap at 6100 as broader momentum dwindles. Momentum indicators have negatively diverged from price since the middle of last year, highlighting the waning enthusiasm investors had been expressing towards tech-heavy benchmarks, like this, amidst extreme valuations. We continue to monitor the potential impact of the apparent rotation in the market on our list of candidates in the market to Accumulate and to Avoid and we have adopted more of a neutral stance as segments that were previously noted as Accumulate candidates fall off (eg. Technology) and as areas to Avoid are added.
Want to know which areas of the market to buy or sell? Our Weekly Chart Books have just been updated, providing a clear Accumulate, Avoid, or Neutral rating for currencies, cryptocurrencies, commodities, broad markets, and subsectors/industries of the market. Subscribers can login and click on the relevant links to access.
- Currencies
- Cryptocurrencies
- Commodities
- Major Benchmarks
- Sub-sectors / Industries
- ETFs: Bonds | Commodities | Equity Markets | Industries | Sectors
Subscribe now.
Today, in our Market Outlook to subscribers, we discuss the following:
- Our weekly chart books update, along with our list of all segments of the market to either Accumulate or Avoid
- Other Notes
- The jump in Steel stocks on Monday
- Near-term downside exhaustion in Metals & Mining Producers
- The break of declining trendline resistance for Copper
Subscribers can look for this report in their inbox or by clicking on the following link and logging in: Market Outlook for February 11
Not signed up yet? Subscribe now to receive full access to all of the research and analysis that we publish.
Sentiment on Monday, as gauged by the put-call ratio, ended bullish at 0.78.
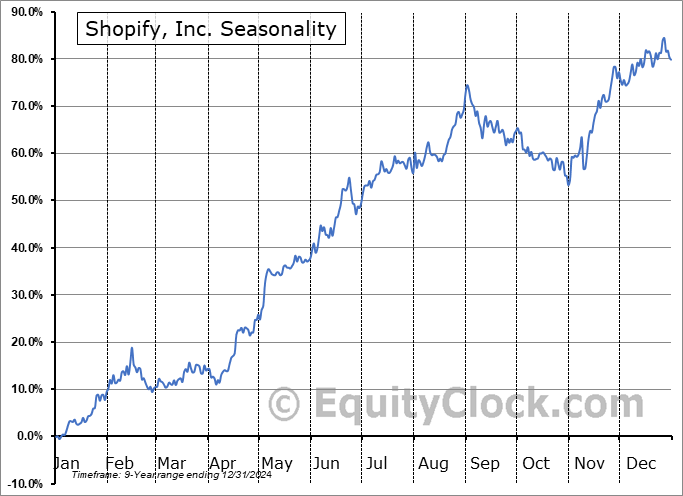
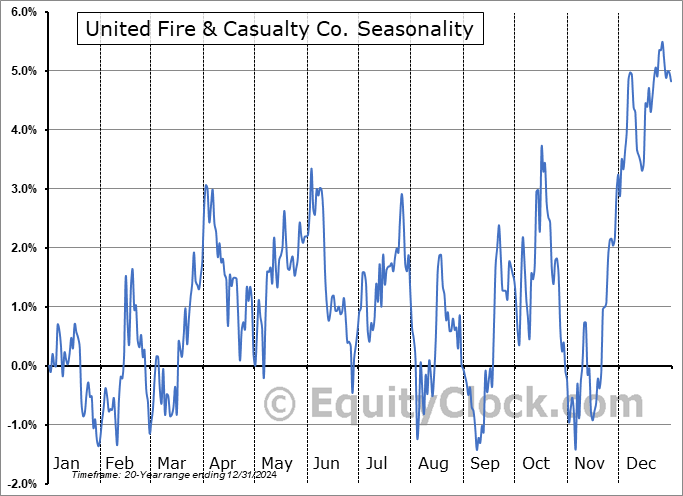
Seasonal charts of companies reporting earnings today:
S&P 500 Index
TSE Composite
| Sponsored By... |

|


