Stock Market Outlook for February 28, 2025

Much chatter over the spike of bearish sentiment according to the AAII, but margin debt that is at a record high points to complacency.
*** Stocks highlighted are for information purposes only and should not be considered as advice to purchase or to sell mentioned securities. As always, the use of technical and fundamental analysis is encouraged in order to fine tune entry and exit points to average seasonal trends.
Stocks Entering Period of Seasonal Strength Today:
Subscribers Click on the relevant link to view the full profile. Not a subscriber? Signup here.

Atmos Energy Corp. (NYSE:ATO) Seasonal Chart

Blackbaud Inc. (NASD:BLKB) Seasonal Chart

Dycom Industries, Inc. (NYSE:DY) Seasonal Chart

Polaris Inds, Inc. (NYSE:PII) Seasonal Chart

Sanofi SA (NASD:SNY) Seasonal Chart
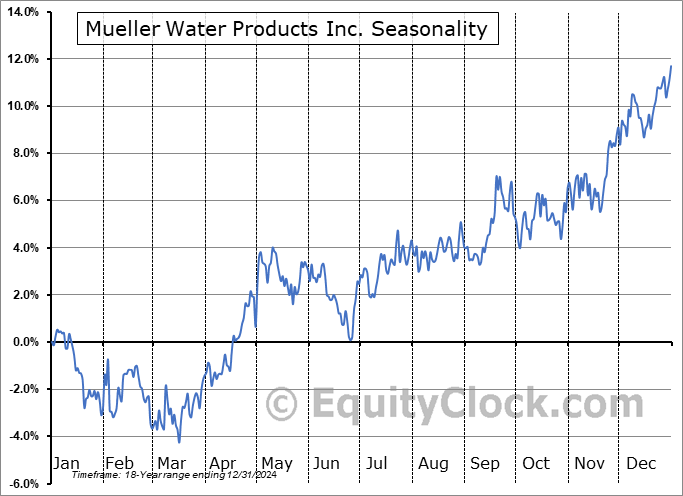
Mueller Water Products Inc. (NYSE:MWA) Seasonal Chart

Chemours Co. (NYSE:CC) Seasonal Chart

ConAgra Brands, Inc. (NYSE:CAG) Seasonal Chart

Quest Diagnostics Inc. (NYSE:DGX) Seasonal Chart

Emera Inc. (TSE:EMA.TO) Seasonal Chart

Shenandoah Telecommunications Co. (NASD:SHEN) Seasonal Chart
Note: Over the past couple of days, our email distributions to Hotmail, MSN, Live, and Outlook address have failed for reasons that are not entirely clear. We have reached out to our email distribution service to see if they can identify the issue and, hopefully, suggest a solution. We apologize for any disruption that you may be experiencing as a result. The issue is isolated and centred around Hotmail email servers. If you wish to change your email address that we have on file, you can do so in the Members section: https://charts.equityclock.com/members We would suggest Gmail given that it is rare that we experience any issues with their servers. Alternatively, recent reports are accessible via the report archive at https://charts.equityclock.com
The Markets
Stocks sold off again on Thursday as tariff concerns and the degradation of economic data that has been realized over the past month weighs on investor sentiment. The S&P 500 Index closed down by 1.59%, showing distinct rejection from resistance at the 50-day moving average (6000). A cap to the benchmark remains overhead around 6100, representing the highs from the past few months. Momentum indicators have negatively diverged from price since the middle of last year, highlighting the waning enthusiasm investors had been expressing towards tech-heavy (Mag-7) benchmarks, like this, amidst extreme valuations. Downside risks on a pullback over the near-term are to the July/August 2024 highs around 5700, a move that would amount to a 7% pullback from recent heights. This would be a healthy and ordinary correction within a bull market, by any measure. We continue to monitor the potential impact of the apparent rotation in the market on our list of candidates in the market to Accumulate and to Avoid and we have adopted more of a neutral stance as segments that were previously noted as Accumulate candidates fall off (eg. Technology) and as areas to Avoid are added.


Today, in our Market Outlook to subscribers, we discuss the following:
- Break of some important short-term levels of support for major market benchmarks
- Broader equity market measures carving out topping patterns
- US Dollar Index stabilizing around its 20-week moving average
- Margin debt and credit balances in trading accounts
- High yield spreads
- Weekly Jobless Claims and the health of the labor market
- Investor sentiment and what to look for to suggest a capitulation in this equity market pullback
Subscribers can look for this report in their inbox or by clicking on the following link and logging in: Market Outlook for February 28
Not signed up yet? Subscribe now to receive full access to all of the research and analysis that we publish.
Sentiment on Thursday, as gauged by the put-call ratio, ended bullish (despite the selloff) at 0.83.

To be released…
We are busy placing the finishing touches on our monthly report for March, providing you with insight and analysis of what to expect through the month(s) ahead. Subscribers can expect this extensive and all-encompassing report to reach their inbox on Friday morning and, soon thereafter, in the report archive.
Not signed up yet? Subscribe now to receive full access to all of the research and analysis that we publish.
Seasonal charts of companies reporting earnings today:


S&P 500 Index


TSE Composite


| Sponsored By... |

|


