Stock Market Outlook for March 6, 2025

US Dollar Index rolling over into its period of seasonal weakness rather abruptly, alleviating a headwind that has worked against risk assets over the past few months.
*** Stocks highlighted are for information purposes only and should not be considered as advice to purchase or to sell mentioned securities. As always, the use of technical and fundamental analysis is encouraged in order to fine tune entry and exit points to average seasonal trends.
Stocks Entering Period of Seasonal Strength Today:
Subscribers Click on the relevant link to view the full profile. Not a subscriber? Signup here.
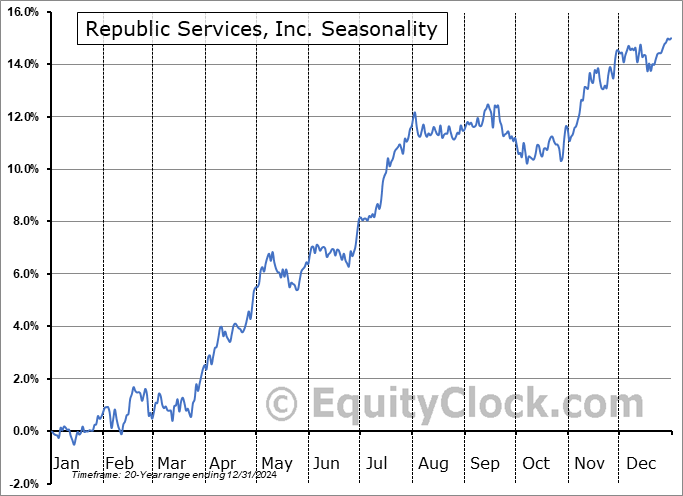
Republic Services, Inc. (NYSE:RSG) Seasonal Chart

Medifast, Inc. (NYSE:MED) Seasonal Chart

MGP Ingredients, Inc. (NASD:MGPI) Seasonal Chart
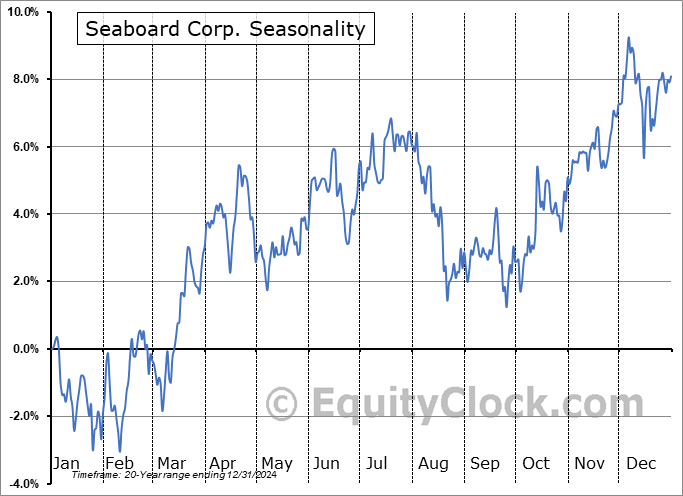
Seaboard Corp. (AMEX:SEB) Seasonal Chart

Evergy, Inc. (NASD:EVRG) Seasonal Chart

Kinaxis Inc. (TSE:KXS.TO) Seasonal Chart

BCM Resources Corp. (TSXV:B.V) Seasonal Chart

Enviri Corporation (NYSE:NVRI) Seasonal Chart
The Markets
Stocks showed relief on Wednesday as traders continue to monitor developments on the tariff front and react to the sharp depreciation of the US Dollar index on the day. The large-cap benchmark recovered from the prior session’s decline to post a gain of 1.12%, continuing to hold support around the 200-day moving average (5728). The short-term trading range between 5830 and 6100 has been broken and the lower limit of the span (5830) is now being pressured as a point of resistance; a short-term declining trend remains intact heading into the often market moving monthly employment report slated to be released on Friday. The more formidable point of resistance remains the declining 50-day moving average at 5988. Momentum indicators on the daily chart have negatively diverged from price since the middle of last year, highlighting the waning enthusiasm investors had been expressing towards tech-heavy (Mag-7) benchmarks, like this, amidst extreme valuations. For now, the drawdown in the market can still be viewed as healthy and ordinary within a bull market, by any measure, but some critical levels below will warrant scrutiny, such as 5700 on the S&P 500 and 73,000 for Bitcoin. Below these thresholds, more dire scenarios for risk assets must be considered. We continue to monitor the potential impact of the apparent rotation in the market on our list of candidates in the market to Accumulate and to Avoid and we have adopted more of a neutral stance as segments that were previously noted as Accumulate candidates fall off (eg. Technology) and as areas to Avoid are added.


Today, in our Market Outlook to subscribers, we discuss the following:
- The sharp depreciation in the US Dollar Index
- US Factory Orders and the investment implications within
- Copper
- The downfall of the price of Oil
- Energy product supply and demand
- What to do with energy stocks at this seasonally strong time of year
- Investor sentiment (Lowest put-call ratio in years)
Subscribers can look for this report in their inbox or by clicking on the following link and logging in: Market Outlook for March 6
Not signed up yet? Subscribe now to receive full access to all of the research and analysis that we publish.
Sentiment on Wednesday, as gauged by the put-call ratio, ended overly bullish at 0.65.

Seasonal charts of companies reporting earnings today:


S&P 500 Index


TSE Composite


| Sponsored By... |

|


