Stock Market Outlook for March 12, 2025

Some of the broader benchmarks of the equity market are breaking below the lower limit of significant topping patterns, presenting downside risks back to the lows charted last August.
*** Stocks highlighted are for information purposes only and should not be considered as advice to purchase or to sell mentioned securities. As always, the use of technical and fundamental analysis is encouraged in order to fine tune entry and exit points to average seasonal trends.
Stocks Entering Period of Seasonal Strength Today:
Subscribers Click on the relevant link to view the full profile. Not a subscriber? Signup here.

Intercure Ltd. (NASD:IRCLF) Seasonal Chart

Obsidian Energy Ltd. (AMEX:OBE) Seasonal Chart

Minera Alamos Inc. (TSXV:MAI.V) Seasonal Chart

EOG Resources, Inc. (NYSE:EOG) Seasonal Chart

Enbridge, Inc. (NYSE:ENB) Seasonal Chart
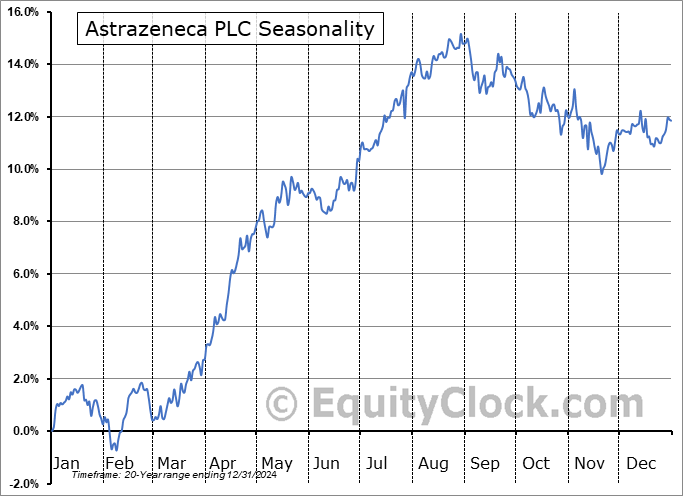
Astrazeneca PLC (NASD:AZN) Seasonal Chart

Ring Energy, Inc. (AMEX:REI) Seasonal Chart

SM Energy Co. (NYSE:SM) Seasonal Chart

Peyto Exploration & Development Corp. (TSE:PEY.TO) Seasonal Chart

NuVista Energy Ltd. (TSE:NVA.TO) Seasonal Chart
The Markets
Stocks continue to find difficulty finding a footing amidst ongoing economic uncertainties as the tariff war evolves. The S&P 500 Index lost just over three-quarters of one percent, pushing further below support around the 200-day moving average (5735). The benchmark is now the furthest below this long-term hurdle since 2022. A declining short-term trend remains intact now that the benchmark is below the trading range it was in previous between 5830 and 6100. A simple sign to suggest that the market is moving beyond this short-term declining path is if the benchmark is able to close above the high of the prior day, something that has not been seen since February 19th. At some point, a checkback of the now declining resistance at the 50-day moving average (5965) is reasonable and likely, at which point the true health of the intermediate-term trajectory of stocks can be determined. Markets that are showing greater resistance than support must be avoided, a framework, on an intermediate-term scale, we have not seen yet. Momentum indicators on the daily chart have negatively diverged from price since the middle of last year, highlighting the waning enthusiasm investors had been expressing towards tech-heavy (Mag-7) benchmarks, like this, amidst extreme valuations. For now, the drawdown in the market can still be viewed as healthy and ordinary within a bull market, by any measure, but scrutiny is certainly warranted now that some critical levels are being tested and/or lost, such as 5700 on the S&P 500 and levels around 73,000 for Bitcoin. Below these thresholds, more dire scenarios for risk assets must be considered. We continue to monitor the potential impact of the apparent rotation in the market on our list of candidates in the market to Accumulate and to Avoid and we have adopted more of a neutral stance as segments that were previously noted as Accumulate candidates fall off (eg. Technology) and as areas to Avoid are added.


Today, in our Market Outlook to subscribers, we discuss the following:
- Broader measures of equity market performance breaking below pronounced topping patterns
- Job Openings and Labor Turnover Survey and the investment implications within
Subscribers can look for this report in their inbox or by clicking on the following link and logging in: Market Outlook for March 12
Not signed up yet? Subscribe now to receive full access to all of the research and analysis that we publish.
Sentiment on Tuesday, as gauged by the put-call ratio, ended bullish at 0.91.

Seasonal charts of companies reporting earnings today:


S&P 500 Index


TSE Composite


| Sponsored By... |

|


