Stock Market Outlook for March 18, 2025

Mean reversion in the market into the end of the quarter has materialized on cue, but some important levels warrant scrutiny ahead as the recovery from oversold lows plays out.
*** Stocks highlighted are for information purposes only and should not be considered as advice to purchase or to sell mentioned securities. As always, the use of technical and fundamental analysis is encouraged in order to fine tune entry and exit points to average seasonal trends.
Stocks Entering Period of Seasonal Strength Today:
Subscribers Click on the relevant link to view the full profile. Not a subscriber? Signup here.

AES Corp. (NYSE:AES) Seasonal Chart

ConocoPhillips (NYSE:COP) Seasonal Chart

Coca Cola Co. (NYSE:KO) Seasonal Chart

Williams Cos., Inc. (NYSE:WMB) Seasonal Chart

Guess?, Inc. (NYSE:GES) Seasonal Chart

Diageo PLC (NYSE:DEO) Seasonal Chart

Kinder Morgan Inc. (NYSE:KMI) Seasonal Chart

Oneok, Inc. (NYSE:OKE) Seasonal Chart
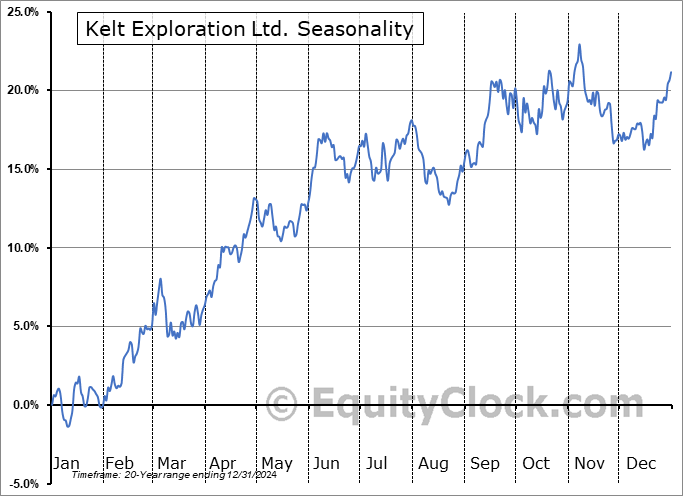
Kelt Exploration Ltd. (TSE:KEL.TO) Seasonal Chart

Anheuser-Busch InBev ADR (NYSE:BUD) Seasonal Chart

TC Energy Corp. (NYSE:TRP) Seasonal Chart

Restaurant Brands International Inc. (NYSE:QSR) Seasonal Chart

Brookfield Real Assets Income Fund Inc. (NYSE:RA) Seasonal Chart
The Markets
Stocks continued to rebound from the oversold lows that were charted into the end of last week as the positivity that normally filters into the equity market at the end of the quarter materializes on cue. The S&P 500 Index ended up by nearly two-thirds of one percent, remaining below support around the 200-day moving average (5742). The declining short-term path has been cracked as price moves above trendline resistance that has constrained the path of lower-lows and lower-highs since the end of February. As has been highlighted relentlessly in this pullback, a simple sign to suggest that the market is moving beyond this short-term declining path is if the benchmark is able to close above the high of the prior day and on Friday it did just that. A check-back of the now declining resistance at the 50-day moving average (5938) is reasonable and likely, at which point the true health of the intermediate-term trajectory of stocks can be determined. Markets that are showing greater resistance than support must be avoided, a framework, on an intermediate-term scale, we have not seen yet. Momentum indicators on the daily chart have negatively diverged from price since the middle of last year, highlighting the waning enthusiasm investors had been expressing towards tech-heavy (Mag-7) benchmarks, like this, amidst extreme valuations. For now, the drawdown in the market can still be viewed as healthy and ordinary within a bull market, by any measure, but scrutiny is certainly warranted now that some critical levels have been lost, such as 5700 on the S&P 500. Below this threshold, more dire scenarios for risk assets must be considered. We continue to monitor the potential impact of the apparent rotation in the market on our list of candidates in the market to Accumulate and to Avoid and we have adopted more of a neutral stance as segments that were previously noted as Accumulate candidates fall off (eg. Technology) and as areas to Avoid are added.


Today, in our Market Outlook to subscribers, we discuss the following:
- Waning buying pressures in bonds as the quarter winds down
- The opportunity in REITs and the industry that we have expressed our preference towards
- Our weekly chart books update, along with our list of all segments of the market to either Accumulate or Avoid
- Other Notes
Subscribers can look for this report in their inbox or by clicking on the following link and logging in: Market Outlook for March 18
Not signed up yet? Subscribe now to receive full access to all of the research and analysis that we publish.
Want to know which areas of the market to buy or sell? Our Weekly Chart Books have just been updated, providing a clear Accumulate, Avoid, or Neutral rating for currencies, cryptocurrencies, commodities, broad markets, and subsectors/industries of the market. Subscribers can login and click on the relevant links to access.
- Currencies
- Cryptocurrencies
- Commodities
- Major Benchmarks
- Sub-sectors / Industries
- ETFs: Bonds | Commodities | Equity Markets | Industries | Sectors
Subscribe now.
Sentiment on Monday, as gauged by the put-call ratio, ended slightly bullish at 0.93.

Seasonal charts of companies reporting earnings today:


S&P 500 Index


TSE Composite


| Sponsored By... |

|


