Stock Market Outlook for March 21, 2025

US Industrial Production is showing the strongest start to the year in the past two decades, but tariff uncertainty has dampened manufacturer sentiment.
*** Stocks highlighted are for information purposes only and should not be considered as advice to purchase or to sell mentioned securities. As always, the use of technical and fundamental analysis is encouraged in order to fine tune entry and exit points to average seasonal trends.
Stocks Entering Period of Seasonal Strength Today:
Subscribers Click on the relevant link to view the full profile. Not a subscriber? Signup here.

Sherwin Williams Co. (NYSE:SHW) Seasonal Chart

Crown Castle Intl Corp. (NYSE:CCI) Seasonal Chart

Northern Shield Resources Inc. (TSXV:NRN.V) Seasonal Chart
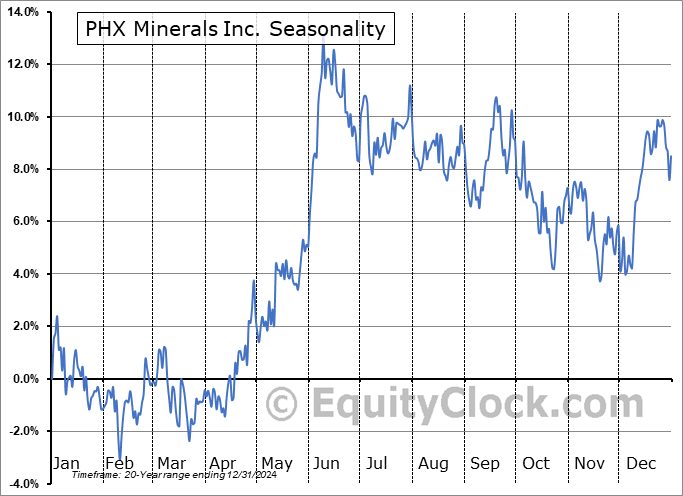
PHX Minerals Inc. (NYSE:PHX) Seasonal Chart

Hennessy Advisors Inc. (NASD:HNNA) Seasonal Chart

American Homes 4 Rent (NYSE:AMH) Seasonal Chart

Flanigans Enterprises, Inc. (AMEX:BDL) Seasonal Chart

Invitation Homes Inc. (NYSE:INVH) Seasonal Chart

Palamina Corp. (TSXV:PA.V) Seasonal Chart
The Markets
Stocks traded fairly mixed on Thursday as it struggles to pull in the next marginal buyer to keep the rebound from last week’s oversold lows afloat. The S&P 500 Index closed down by just over two-tenths of one percent, remaining below support around the 200-day moving average (5748). The benchmark continues to hold above short-term declining trendline resistance from the past month, but near-term upside momentum is taking a bit of a hit heading into the end of the week. A check-back of the now declining resistance at the 50-day moving average (5921) remains our base case, at which point the true health of the intermediate-term trajectory of stocks can be determined, but we must be prepared for the possibility of a weaker recovery from the lows than has been anticipated. Hesitation around the 200-day moving average certainly raises concerns among those running short, intermediate, and long-term strategies and a failure here would certainly be representative of the heightened concern among investors. Markets that are showing greater resistance than support must be avoided, a framework, on an intermediate-term scale, we have not seen yet. Momentum indicators on the daily chart have negatively diverged from price since the middle of last year, highlighting the waning enthusiasm investors had been expressing towards tech-heavy (Mag-7) benchmarks, like this, amidst extreme valuations. For now, the drawdown in the market can still be viewed as healthy and ordinary within a bull market, by any measure, but scrutiny is certainly warranted now that some critical levels were broken during the correction, such as 5700 on the S&P 500. Below this threshold, more dire scenarios for risk assets must be considered. We continue to monitor the potential impact of the apparent rotation in the market on our list of candidates in the market to Accumulate and to Avoid and we have adopted more of a neutral stance as segments that were previously noted as Accumulate candidates fall off (eg. Technology) and as areas to Avoid are added.


Today, in our Market Outlook to subscribers, we discuss the following:
- US Industrial Production and the investment implications within
- Manufacturer Sentiment
- The Industrial Sector
- Weekly Jobless Claims and the health of the labor market
Subscribers can look for this report in their inbox or by clicking on the following link and logging in: Market Outlook for March 21
Not signed up yet? Subscribe now to receive full access to all of the research and analysis that we publish.
Sentiment on Thursday, as gauged by the put-call ratio, ended bullish at 0.81.

Seasonal charts of companies reporting earnings today:


S&P 500 Index


TSE Composite


| Sponsored By... |

|


