Stock Market Outlook for April 7, 2025

The S&P 500 Index has broken below its intermediate-term rising trend channel, bringing an end to the bull market path that supported domestic equities since October of 2022.
*** Stocks highlighted are for information purposes only and should not be considered as advice to purchase or to sell mentioned securities. As always, the use of technical and fundamental analysis is encouraged in order to fine tune entry and exit points to average seasonal trends.
Stocks Entering Period of Seasonal Strength Today:
Subscribers Click on the relevant link to view the full profile. Not a subscriber? Signup here.

United States Natural Gas Fund (NYSE:UNG) Seasonal Chart

frontdoor, inc. (NASD:FTDR) Seasonal Chart

Thor Explorations Ltd. (TSXV:THX.V) Seasonal Chart

Discover Financial Services (NYSE:DFS) Seasonal Chart

MFS Investment Grade Municipal Fund (NYSE:CXH) Seasonal Chart

Questor Technology, Inc. (TSXV:QST.V) Seasonal Chart

Autonation, Inc. (NYSE:AN) Seasonal Chart

HSBC Holdings PLC (NYSE:HSBC) Seasonal Chart
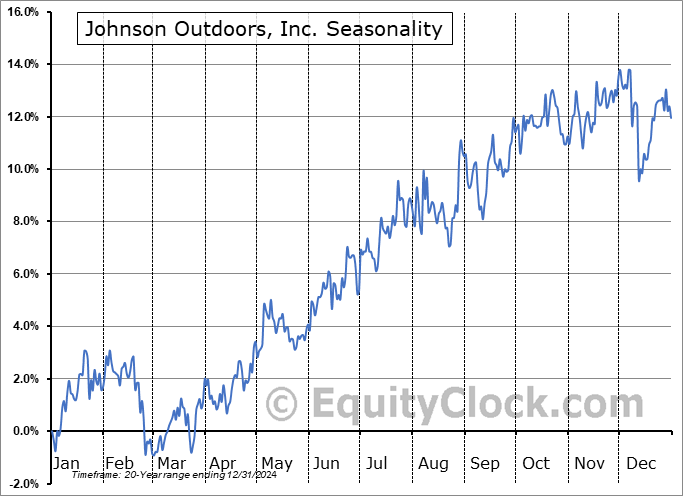
Johnson Outdoors, Inc. (NASD:JOUT) Seasonal Chart

Boyd Group Income Fund (TSE:BYD.TO) Seasonal Chart

Donnelley Financial Solutions, Inc. (NYSE:DFIN) Seasonal Chart
The Markets
The destruction in the equity market that was triggered by Wednesday’s Trump tariff announcement continued into the end of the week as market participants rapidly price in the prospect of a global economic recession as a result of the protectionist policy. The S&P 500 Index closed down by 5.97%, opening another gap around a point of implied support at 5300 and moving back toward 52-week lows. The benchmark remains in a precarious state heading into the second quarter, holding levels below the 200-day moving average, a variable hurdle that traditionally provides a reasonable dividing line between long-term bullish and bearish trends. The prospects of a check-back of the declining resistance at the 50-day moving average (~5844) has not been taken off the table, but headline risks, obviously, have to be contended with in the very near-term; the pace of downside acceleration in this intermediate-term moving average seems likely to catch up with price faster than any upbeat level that could have been foreseen of it previous. We are still in this period of seasonal strength that runs through the month of April, therefore we are biased to let this favourable timeframe show what it is capable of; the more likely time to see the next evolution of the declining intermediate-term path for stocks is through the off-season that starts in May. We have not made any changes to our Super Simple Seasonal Portfolio, yet (as painful as it has been over the past 48 hours given our intermediate-term neutral bias that has been desired), following our tactical positioning to take advantage of the positivity that surrounds the end of the quarter, but we are cognizant that the multi-month path of stocks (most importance to us in our work) is under significant threat. We continue to monitor the potential impact of the apparent rotation in the market on our list of candidates in the market to Accumulate and to Avoid and we have adopted more of a neutral stance as segments that were previously noted as Accumulate candidates fall off (eg. Technology) and as areas to Avoid are added.


Today, in our Market Outlook to subscribers, we discuss the following:
- Weekly look at the large-cap benchmark
- Bearish extremes becoming increasingly heightened
- US Employment Situation and the investment implications within
- The above average trend of wages and what is driving this change
- Canada Labour Force Survey and the investment implications within
- The strongest first quarter increase in part-time employment in over four decades
- The change in Canadian Unemployment
Subscribers can look for this report in their inbox or by clicking on the following link and logging in: Market Outlook for April 7
Not signed up yet? Subscribe now to receive full access to all of the research and analysis that we publish.
Sentiment on Friday, as gauged by the put-call ratio, ended overly bearish at 1.21.

Seasonal charts of companies reporting earnings today:


S&P 500 Index


TSE Composite


| Sponsored By... |

|


