Stock Market Outlook for April 21, 2025

Watch the 4800 to 4950 zone for the S&P 500 Index as a violation of this range through the off-season for stocks would likely indicate that the economy is in recession.
*** Stocks highlighted are for information purposes only and should not be considered as advice to purchase or to sell mentioned securities. As always, the use of technical and fundamental analysis is encouraged in order to fine tune entry and exit points to average seasonal trends.
Stocks Entering Period of Seasonal Strength Today:
Subscribers Click on the relevant link to view the full profile. Not a subscriber? Signup here.

Invesco DWA Technology Momentum ETF (NASD:PTF) Seasonal Chart

IDEAYA Biosciences, Inc. (NASD:IDYA) Seasonal Chart

Electrovaya, Inc. (TSE:ELVA.TO) Seasonal Chart

Technology Select Sector SPDR Fund (NYSE:XLK) Seasonal Chart
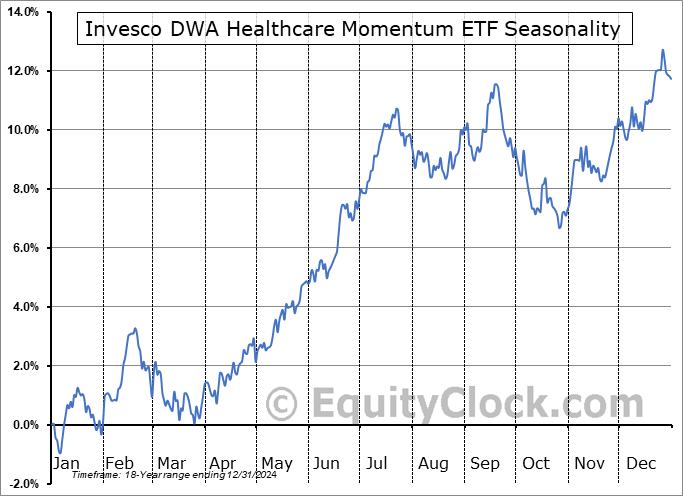
Invesco DWA Healthcare Momentum ETF (NASD:PTH) Seasonal Chart

Gabelli Utility Trust (NYSE:GUT) Seasonal Chart

Sypris Solutions, Inc. (NASD:SYPR) Seasonal Chart

Nikola Corporation (NASD:NKLA) Seasonal Chart

CareCloud, Inc. (NASD:CCLD) Seasonal Chart
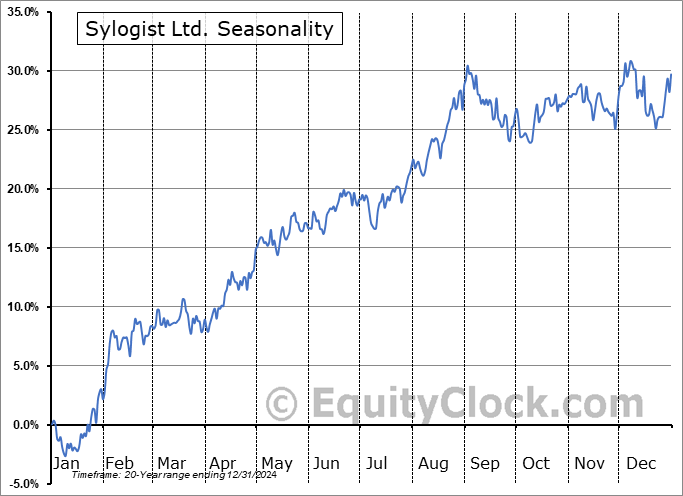
Sylogist Ltd. (TSE:SYZ.TO) Seasonal Chart

Apartment Investment and Management Co. (NYSE:AIV) Seasonal Chart

ServiceNow, Inc. (NYSE:NOW) Seasonal Chart

ICON PLC (NASD:ICLR) Seasonal Chart
The Markets
Stocks struggled to gain a footing on Thursday as investors refrained from placing any significant bets ahead of the long weekend. The S&P 500 Index ended higher by just over a tenth of one percent, continuing to hold below the pre-tariff announcement lows around 5500. There is a cap over this market in the range between 5500 and 5800 that would likely require a catalyst to break; without one, look for the sellers to step in around this zone. As has been pointed out, the benchmark remains in a precarious state heading into the second quarter, holding levels below the 200-day moving average, a variable hurdle that is now rolling over and providing a characteristic of an intermediate to long-term bearish trend. Unfortunately, this technical degradation in the market has come during this period of seasonal strength that runs through the month of April, therefore we are biased to let this favourable timeframe show what it is capable of before taking action; the more likely time that the next evolution of the declining intermediate-to-long-term trend for stocks should occur is through the off-season that starts in May. We continue to leave our Super Simple Seasonal Portfolio as is, but we are cognizant of the need to do something ahead to mitigate the threat that the intermediate-term trend is portraying. We continue to monitor the potential impact of the rotation in the market on our list of candidates in the market to Accumulate and to Avoid, but we have been finding things to buy amidst this market tumult.


Today, in our Market Outlook to subscribers, we discuss the following:
- Weekly look at the large-cap benchmark
- The ultra-long-term trend of the market and the significant zone to watch through the off-season for stocks
- US Industrial Production and the investment implications within
- Manufacturer Sentiment
- The Industrial Sector
Subscribers can look for this report in their inbox or by clicking on the following link and logging in: Market Outlook for April 21
Not signed up yet? Subscribe now to receive full access to all of the research and analysis that we publish.
Sentiment on Thursday, as gauged by the put-call ratio, ended slightly bullish at 0.92.

Seasonal charts of companies reporting earnings today:


S&P 500 Index


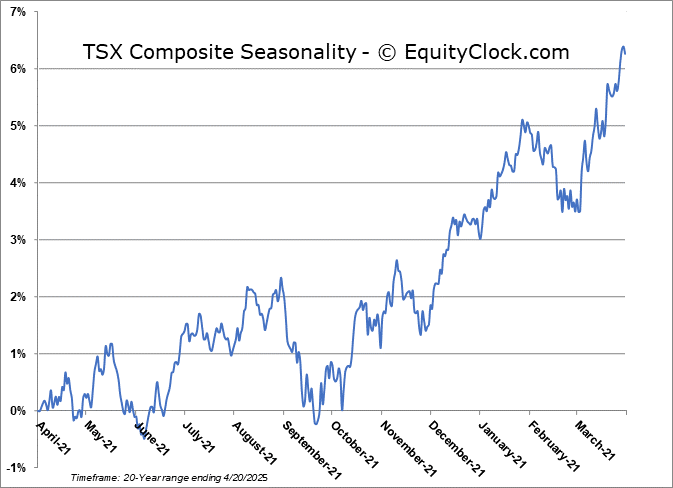
TSE Composite

| Sponsored By... |

|


