Stock Market Outlook for July 14, 2025

Precious metals are back on the move, generating alpha for portfolios as they typically do heading through the third quarter.
*** Stocks highlighted are for information purposes only and should not be considered as advice to purchase or to sell mentioned securities. As always, the use of technical and fundamental analysis is encouraged in order to fine tune entry and exit points to average seasonal trends.
Stocks Entering Period of Seasonal Strength Today:
Subscribers Click on the relevant link to view the full profile. Not a subscriber? Signup here.

United Parcel Service, Inc. (NYSE:UPS) Seasonal Chart

ZYNEX Inc. (NASD:ZYXI) Seasonal Chart
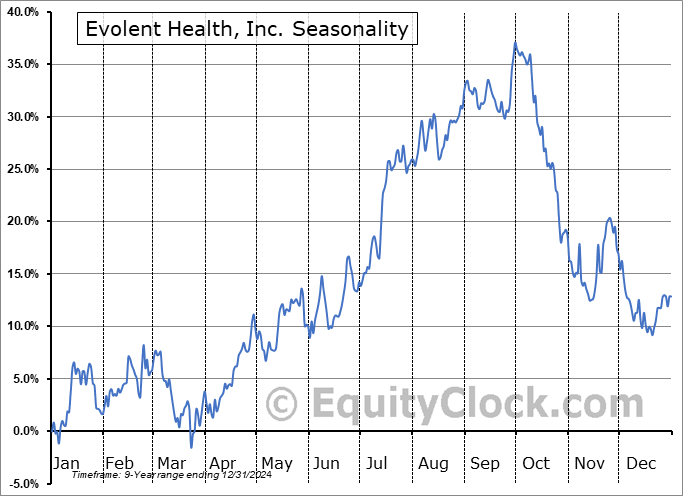
Evolent Health, Inc. (NYSE:EVH) Seasonal Chart

iShares Canadian Financial Monthly Income ETF (TSE:FIE.TO) Seasonal Chart

Vanguard U.S. Dividend Appreciation Index ETF (TSE:VGG.TO) Seasonal Chart
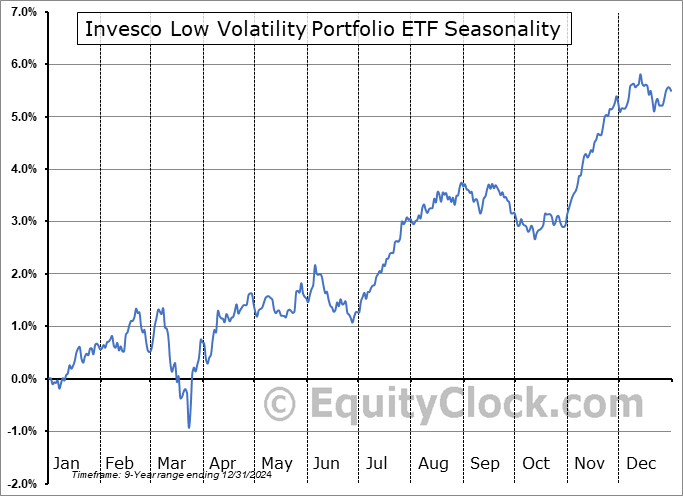
Invesco Low Volatility Portfolio ETF (TSE:PLV.TO) Seasonal Chart
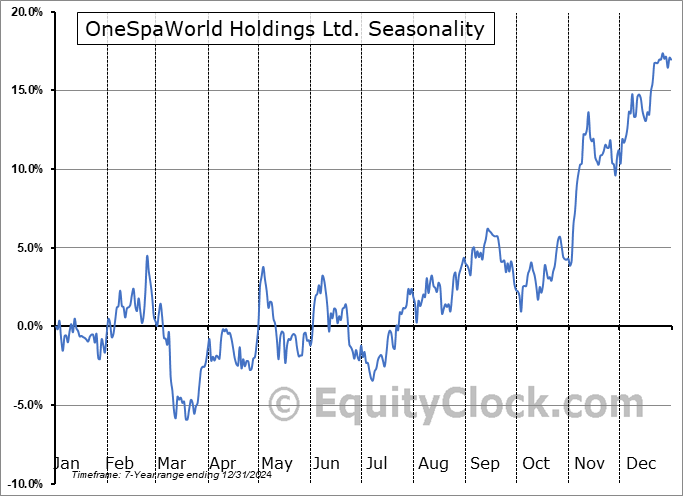
OneSpaWorld Holdings Ltd. (NASD:OSW) Seasonal Chart

JPMorgan U.S. Quality Factor ETF (AMEX:JQUA) Seasonal Chart

SPDR Russell 1000 Low Volatility Focus ETF (AMEX:ONEV) Seasonal Chart

Purpose Tactical Investment Grade Bond Fund (TSE:BND.TO) Seasonal Chart

Invesco S&P SmallCap Low Volatility ETF (AMEX:XSLV) Seasonal Chart

Vanguard Mortgage-Backed Securities ETF (NASD:VMBS) Seasonal Chart

Vanguard Short-Term Corporate Bond ETF (NASD:VCSH) Seasonal Chart

DraftKings Inc (NASD:DKNG) Seasonal Chart

Vanguard Intermediate-Term Corporate Bond ETF (NASD:VCIT) Seasonal Chart

Richardson Electronics, Ltd. (NASD:RELL) Seasonal Chart

BMO Equal Weight U.S. Banks Index ETF (TSE:ZBK.TO) Seasonal Chart

Canadian Imperial Bank Of Commerce (NYSE:CM) Seasonal Chart

Raymond James Financial Inc. (NYSE:RJF) Seasonal Chart

Royal Caribbean Cruises (NYSE:RCL) Seasonal Chart

CBOE Global Markets Inc. (AMEX:CBOE) Seasonal Chart

Invesco BuyBack Achievers ETF (NASD:PKW) Seasonal Chart

SPDR S&P Bank ETF (NYSE:KBE) Seasonal Chart

iShares U.S. Financials ETF (NYSE:IYF) Seasonal Chart

SPDR Barclays Convertible Securities ETF (NYSE:CWB) Seasonal Chart

iShares Agency Bond ETF (NYSE:AGZ) Seasonal Chart
The Markets
Stocks traded off of the record highs that were recorded in the session prior as ongoing tariff developments gave investors pause. The S&P 500 Index ended down by a third of one percent as a result of digestion of the recent strength in the materials and financial sectors. Support at the cloud of major moving averages remains well defined, including the 20-day moving average (6133), a variable hurdle that has been unviolated throughout the bull-market rally from the April lows. Until some of the implied levels of support start to crack, this market still has the appearance of having an easier ability to excel above levels of resistance than to fail below levels of support. While overbought signals have triggered according to various metrics in recent days, this should be viewed as a sign of strength given that market participants continue to desire putting funds to work around these heights. Our list of candidates in the market that are worthy to Accumulate or Avoid continues to be appropriately positioned, keeping investors tuned into those segments of the market that are working in such areas as in the Technology, Communication Services, Financials, and Utilities sectors.

Today, in our Market Outlook to subscribers, we discuss the following:
- Weekly look at the large-cap benchmark
- Precious metals on the move
- Canada Labour Force Survey and the investment implications within
- Canadian Dollar
Subscribers can look for this report in their inbox or by clicking on the following link and logging in: Market Outlook for July 14
Not signed up yet? Subscribe now to receive full access to all of the research and analysis that we publish
Sentiment on Friday, as gauged by the put-call ratio, ended bullish at 0.84.

Seasonal charts of companies reporting earnings today:


S&P 500 Index


TSE Composite


| Sponsored By... |

|


