Stock Market Outlook for September 25, 2025

The dynamics of supply and demand are conducive to support the price of Oil through its period of weakness heading through the fall.
*** Stocks highlighted are for information purposes only and should not be considered as advice to purchase or to sell mentioned securities. As always, the use of technical and fundamental analysis is encouraged in order to fine tune entry and exit points to average seasonal trends.
Stocks Entering Period of Seasonal Strength Today:
Subscribers Click on the relevant link to view the full profile. Not a subscriber? Signup here.

XPO Logistics, Inc. (NYSE:XPO) Seasonal Chart

Vista Oil & Gas SAB (NYSE:VIST) Seasonal Chart

US Global Jets ETF (AMEX:JETS) Seasonal Chart

Adams Resources & Energy, Inc. (AMEX:AE) Seasonal Chart

Akamai Technologies, Inc. (NASD:AKAM) Seasonal Chart

H&E Equipment Services Inc. (NASD:HEES) Seasonal Chart

Rush Enterprises Inc. (NASD:RUSHA) Seasonal Chart

Lear Corp. (NYSE:LEA) Seasonal Chart

Granite Construction Inc. (NYSE:GVA) Seasonal Chart

Graco, Inc. (NYSE:GGG) Seasonal Chart
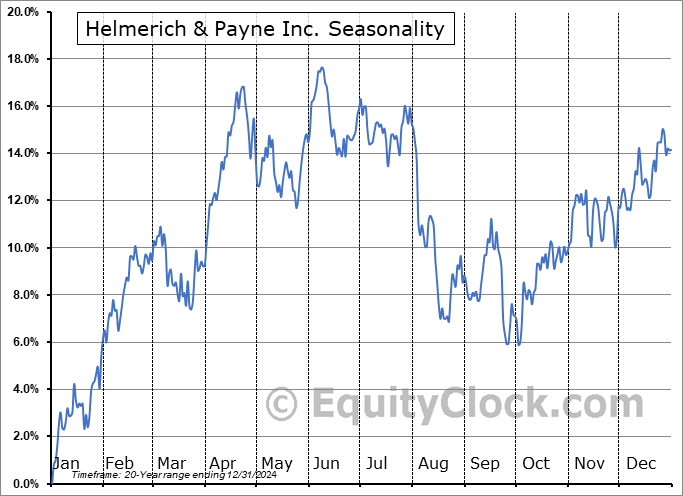
Helmerich & Payne Inc. (NYSE:HP) Seasonal Chart

FedEx Corp. (NYSE:FDX) Seasonal Chart
The Markets
Stocks drifted lower on Wednesday as the digestion of some of the gains recorded in the market through the third quarter continues. The S&P 500 Index ended down by nearly three-tenths of one percent, pulling the week-to-date change negative heading through the last full week of September. Support continues to hold at the 20-day moving average (~6555), the variable hurdle that has kept the short-term trend off of the April lows intact. The Relative Strength Index (RSI) is rolling over from overbought territory above 70 as buying exhaustion is hinted. The weakest, most volatile, period for the equity market is upon us, running through the last couple of weeks of the month (the first half of September is normally positive), leaving us with a cautious bias pertaining to broad equity exposure in the very near-term. The strategy remains to avoid being aggressive in risk (stocks) for now (over the next couple of weeks), but take advantage of any volatility shocks (should they materialize) to increase the risk profile of portfolios ahead of the best six months of the year for stocks that gets underway in October. We have picked our spots in the market to which we want to be exposed (including various technology subsectors) in our list of candidates in the market that are worthy to Accumulate or Avoid and the performance continues to be exceptional. Those themes that are enduring according to our three-pronged approach incorporating seasonal, technical, and fundamental analysis keeps us focused and we are not concerned, at all, if the broad market weakness that is normal of September fails to materialize.

Today, in our Market Outlook to subscribers, we discuss the following:
- US New Home Sales and homebuilding stocks
- Hint of the start of the rollover of new homes for sale from multi-year highs
- Energy supply/demand and the support it is presenting to energy commodity prices, along with the stocks of producers
Subscribers can look for this report in their inbox or by clicking on the following link and logging in: Market Outlook for September 25
Not signed up yet? Subscribe now to receive full access to all of the research and analysis that we publish
Sentiment on Wednesday, as gauged by the put-call ratio, ended bullish at 0.86.

Seasonal charts of companies reporting earnings today:


S&P 500 Index


TSE Composite


| Sponsored By... |

|


