Stock Market Outlook for October 16, 2025

Canada’s macro-economic backdrop looks pretty dire, but the stocks are looking good.
*** Stocks highlighted are for information purposes only and should not be considered as advice to purchase or to sell mentioned securities. As always, the use of technical and fundamental analysis is encouraged in order to fine tune entry and exit points to average seasonal trends.
Stocks Entering Period of Seasonal Strength Today:
Subscribers Click on the relevant link to view the full profile. Not a subscriber? Signup here.
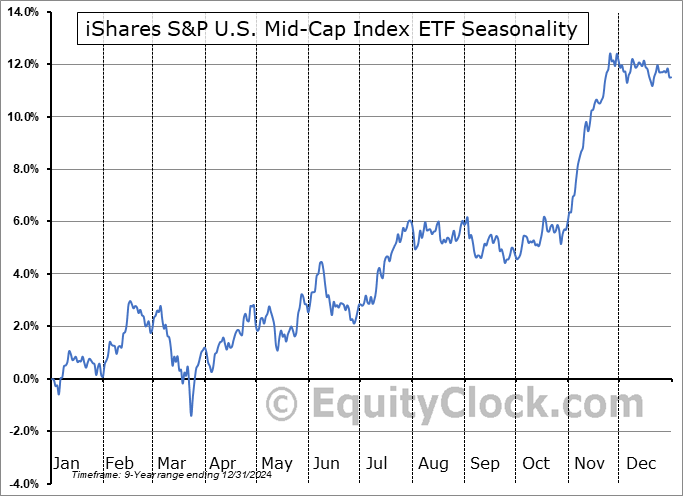
iShares S&P U.S. Mid-Cap Index ETF (TSE:XMC.TO) Seasonal Chart

Bragg Gaming Group Inc. (NASD:BRAG) Seasonal Chart
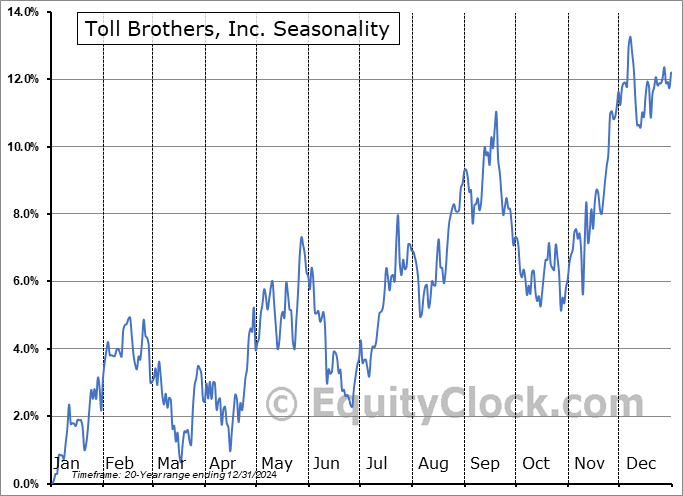
Toll Brothers, Inc. (NYSE:TOL) Seasonal Chart

SPDR S&P Aerospace & Defense ETF (NYSE:XAR) Seasonal Chart

Air Lease Corp. (NYSE:AL) Seasonal Chart

Vericel Corp. (NASD:VCEL) Seasonal Chart

Domino’s Pizza Group LTD (NYSE:DPZ) Seasonal Chart
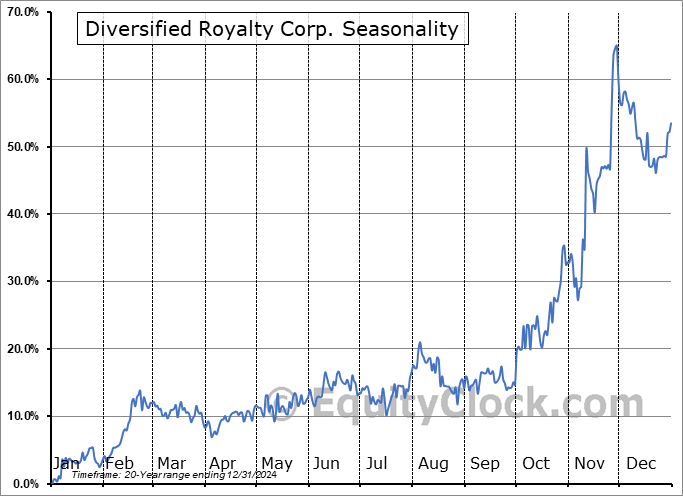
Diversified Royalty Corp. (TSE:DIV.TO) Seasonal Chart
The Markets
Stocks closed mildly higher on Wednesday as upbeat earnings helped to offset concerns on the trade front following the reflaring of tensions between the US and China at the end of last week. The large-cap benchmark ended higher by four-tenths of one percent, charting a doji indecision candlestick at the 20-day moving average (~6674). The variable hurdle had kept the short-term trend off of the April lows intact. The 50-day moving average (6551) is presently attempting to mitigate a more serious downfall through the weeks ahead. The volatility index continues to move higher from a bottoming pattern and the US Dollar remains positively sloped in the short-term, both aligned with seasonal norms and suggesting that the market may not be in the clear toward broad risk exposure, yet. October is the month when fear/volatility hit a peak and, in an instant, the month is showing this unsettled state. Despite the transition out of the weakest two-week stretch of the year for stocks at the end of September, the strategy has remained the same, which is to avoid being aggressive in risk (stocks) for now (over the next couple of weeks), but take advantage of the volatility shock to increase the risk profile of portfolios ahead of the best six months of the year for stocks that gets underway at the end of October. We have picked our spots in the market to which we want to be exposed, both through and beyond the period of seasonal volatility, in our list of candidates in the market that are worthy to Accumulate or Avoid and this will be an ideal starting point to build up allocations for the best six month of the year timeframe. We will continue to allow for the possibility of volatility to ramp up through the days/weeks ahead and position the risk metrics of portfolios appropriately until a more ideal setup to reach out on the risk spectrum (eg. away from bonds/gold and towards our four desired sectors to be exposed) is revealed. The Seasonal Advantage Portfolio that we oversee at Castlemoore continues to be well positioned, outperforming the market.

Today, in our Market Outlook to subscribers, we discuss the following:
- Canada Manufacturing Sales and the investment implications within
- The Canadian Dollar
- Tendencies for the TSX Composite through the best six months of the year for stocks
Subscribers can look for this report in their inbox or by clicking on the following link and logging in: Market Outlook for October 16
Not signed up yet? Subscribe now to receive full access to all of the research and analysis that we publish
Sentiment on Wednesday, as gauged by the put-call ratio, ended bullish at 0.78.

Seasonal charts of companies reporting earnings today:


S&P 500 Index


TSE Composite


| Sponsored By... |

|


