Stock Market Outlook for November 4, 2025

US Supreme Court ruling on tariffs could be highly influential to the performance of the dollar, stocks, and bonds in the near-term.
*** Stocks highlighted are for information purposes only and should not be considered as advice to purchase or to sell mentioned securities. As always, the use of technical and fundamental analysis is encouraged in order to fine tune entry and exit points to average seasonal trends.
Stocks Entering Period of Seasonal Strength Today:
Subscribers Click on the relevant link to view the full profile. Not a subscriber? Signup here.

BMTC Group, Inc. (TSE:GBT.TO) Seasonal Chart

Upbound Group, Inc. (NASD:UPBD) Seasonal Chart

Fiserv, Inc. (NYSE:FI) Seasonal Chart
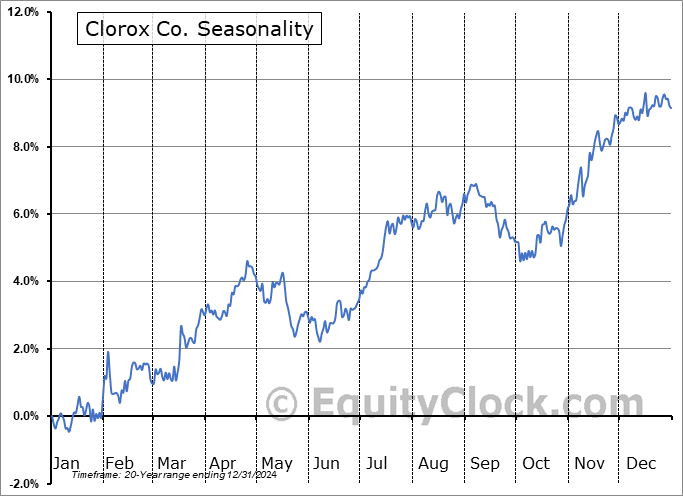
Clorox Co. (NYSE:CLX) Seasonal Chart

Flexsteel Industries, Inc. (NASD:FLXS) Seasonal Chart

Haverty Furniture Cos., Inc. (NYSE:HVT) Seasonal Chart
The Markets
Stocks closed generally mixed on Monday as Growth names in the Technology and Consumer Discretionary sectors offset evolving weakness in Core-Cyclcial/Value segments (eg. Materials, Industrials). The S&P 500 Index ended higher by just less than two-tenths of one percent, continuing to hold near-term support in the range of the October 27th upside open gap between 6807 and 6843. Another upside gap charted on October 24th between 6749 and 6772 has gone unfilled, thus far, presenting a subsequent zone of short-term support that the bulls are likely to use to shoot bets against. The 50-day moving average (6647) has so far mitigated a more serious downfall as the pullback that many were hoping for in order to add to risk exposure for the end of the year fails to produce results of significance. While benchmarks are showing greater evidence of support than resistance, a backdrop that warrants a positive view of the market, breadth is becoming increasingly poor, leaving few players in this market to perform the heavy lifting heading into the start of the best six months of the year performance for stocks. The result contributes to our rather unsettled position that we are burdened by. While the segments of the market that we continue to target in our weekly chart books remain correctly dialed in, we have been hesitant to signal the all-clear towards broader risk exposure, as has historically been easy to do at this time of year. October is the time of year when fear/volatility hit a peak and buying into the unease is typically the prudent approach. Last year, the “all-clear” signal was revealed at the start of November and we were subsequently forced to reign in risk around the start of February ahead of the equity market pullback that denied a positive outcome to the best six month trade last year. For now, we continue to lean on our list of candidates in the market that are worthy to Accumulate or Avoid, which continues to show far more ideas worthy to buy than to sell, but advocating to increase portfolio sensitivity to the broader market at this point, aligned with the average start to the best six months of the year performance, is difficult to do. The more ideal entry points for an intermediate-term (multi-month) holding period can be pegged around rising 20-week moving averages, which major market benchmarks are stretched well above. This is not negative, but rather less than ideal to assure that we’re ramping up equity exposure at preferable risk-reward points.

Want to know which areas of the market to buy or sell? Our Weekly Chart Books have just been updated, providing a clear Accumulate, Avoid, or Neutral rating for currencies, cryptocurrencies, commodities, broad markets, and subsectors/industries of the market. Subscribers can login and click on the relevant links to access.
- Currencies
- Cryptocurrencies
- Commodities
- Major Benchmarks
- Sub-sectors / Industries
- ETFs: Bonds | Commodities | Equity Markets | Industries | Sectors
Subscribe now.
Today, in our Market Outlook to subscribers, we discuss the following:
- Our weekly chart books update, along with our list of all segments of the market to either Accumulate or Avoid
- Other Notes
Subscribers can look for this report in their inbox or by clicking on the following link and logging in: Market Outlook for November 4
Not signed up yet? Subscribe now to receive full access to all of the research and analysis that we publish
Sentiment on Monday, as gauged by the put-call ratio, ended close to neutral at 0.90.

Seasonal charts of companies reporting earnings today:


S&P 500 Index


TSE Composite


| Sponsored By... |

|


