Stock Market Outlook for November 12, 2025

Pursuing an “emerging” seasonal opportunity into year end now that volatility is coming in and headwinds that threatened previous alleviate.
*** Stocks highlighted are for information purposes only and should not be considered as advice to purchase or to sell mentioned securities. As always, the use of technical and fundamental analysis is encouraged in order to fine tune entry and exit points to average seasonal trends.
Stocks Entering Period of Seasonal Strength Today:
Subscribers Click on the relevant link to view the full profile. Not a subscriber? Signup here.

Invesco Municipal Opportunity Trust (NYSE:VMO) Seasonal Chart

Generation Mining Ltd. (TSE:GENM.TO) Seasonal Chart

Timbercreek Financial Corp. (TSE:TF.TO) Seasonal Chart
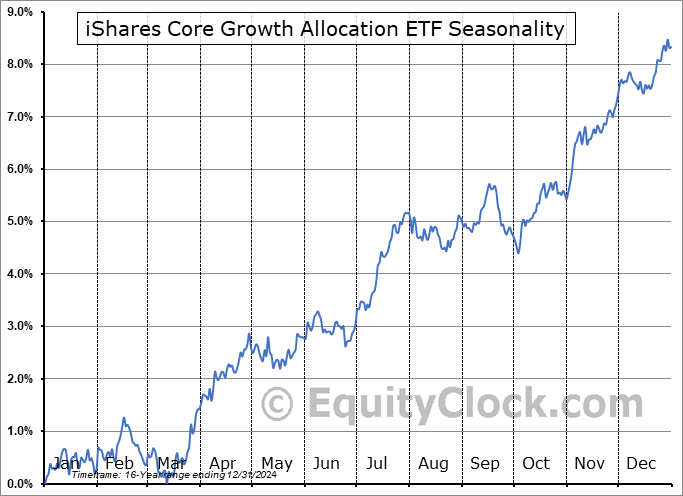
iShares Core Growth Allocation ETF (NYSE:AOR) Seasonal Chart

Church & Dwight Co, Inc. (NYSE:CHD) Seasonal Chart

Plaza Retail REIT (TSE:PLZ/UN.TO) Seasonal Chart

Riocan Real Estate Investment Trust (TSE:REI/UN.TO) Seasonal Chart

iShares U.S. Telecommunications ETF (NYSE:IYZ) Seasonal Chart

Mattel, Inc. (NASD:MAT) Seasonal Chart

iShares Latin America 40 ETF (NYSE:ILF) Seasonal Chart

iShares Russell Mid-Cap Value ETF (NYSE:IWS) Seasonal Chart

VanEck Vectors Uranium+Nuclear Energy ETF (NYSE:NLR) Seasonal Chart

Invesco Water Resources ETF (NASD:PHO) Seasonal Chart

SPDR S&P Metals and Mining ETF (NYSE:XME) Seasonal Chart

Interpublic Grp Of Cos (NYSE:IPG) Seasonal Chart

Sonoco Products Co. (NYSE:SON) Seasonal Chart

Packaging Corp Of America (NYSE:PKG) Seasonal Chart

Northland Power Inc. (TSE:NPI.TO) Seasonal Chart

National Fuel Gas Co. (NYSE:NFG) Seasonal Chart

Cheniere Energy, Inc. (NYSE:LNG) Seasonal Chart

CBRE Group, Inc. (NYSE:CBRE) Seasonal Chart

Rexford Industrial Realty, Inc. (NYSE:REXR) Seasonal Chart

iShares MSCI Mexico Capped ETF (NYSE:EWW) Seasonal Chart
Note: Respecting Veterans Day in the US and Remembrance Day in Canada, there will be no report released on Tuesday, November 11th. Our next report will be released on Wednesday.
The Markets
Stocks jumped on Monday as traders found relief that Congress may actually bring an end to the government shutdown that is now into a record-setting 41 days. The S&P 500 Index closed higher by 1.54%, elevating from support at the 50-day moving average (6677) that was tested on Friday at the lows of the day. The hourly chart shows an ongoing “twitchiness” that is sprinkling the chart with gaps. The benchmark has jumped back above the October 24th gap and is now testing downside gap resistance that was charted on November 4th between 6809 and 6845. Volatility is coming in and, gradually, the technical cues that kept us cautious of taking on new risk exposure for the best six months of the year are fading, but there is reason to not expect much of equity market performance through the next week and a half (or so). We continue to lean heavily on our list of candidates in the market that are worthy to Accumulate or Avoid, which continues to show far more ideas worthy to buy than to sell.


Want to know which areas of the market to buy or sell? Our Weekly Chart Books have just been updated, providing a clear Accumulate, Avoid, or Neutral rating for currencies, cryptocurrencies, commodities, broad markets, and subsectors/industries of the market. Subscribers can login and click on the relevant links to access.
- Currencies
- Cryptocurrencies
- Commodities
- Major Benchmarks
- Sub-sectors / Industries
- ETFs: Bonds | Commodities | Equity Markets | Industries | Sectors
Subscribe now.
Today, in our Market Outlook to subscribers, we discuss the following:
- Our weekly chart books update, along with our list of all segments of the market to either Accumulate or Avoid
- Other Notes
- The action we are taking in the Super Simple Seasonal Portfolio
Subscribers can look for this report in their inbox or by clicking on the following link and logging in: Market Outlook for November 12
Not signed up yet? Subscribe now to receive full access to all of the research and analysis that we publish
Sentiment on Monday, as gauged by the put-call ratio, ended bullish at 0.83.

Seasonal charts of companies reporting earnings today:


S&P 500 Index


TSE Composite


| Sponsored By... |

|


