Stock Market Outlook for November 17, 2025

Weekly indecision in stocks points to waiting for pre-Thanksgiving buying opportunities.
*** Stocks highlighted are for information purposes only and should not be considered as advice to purchase or to sell mentioned securities. As always, the use of technical and fundamental analysis is encouraged in order to fine tune entry and exit points to average seasonal trends.
Stocks Entering Period of Seasonal Strength Today:
Subscribers Click on the relevant link to view the full profile. Not a subscriber? Signup here.
ATS Corporation (TSE:ATS.TO) Seasonal Chart
PIMCO Income Strategy Fund (NYSE:PFL) Seasonal Chart
Hess Midstream Partners LP (NYSE:HESM) Seasonal Chart
Skechers Usa, Inc. (NYSE:SKX) Seasonal Chart
Pilgrims Pride Corp. (NASD:PPC) Seasonal Chart
Illumina, Inc. (NASD:ILMN) Seasonal Chart
Barrick Gold Corp. (NYSE:GOLD) Seasonal Chart
Enbridge, Inc. (TSE:ENB.TO) Seasonal Chart
Algonquin Power & Utilities Corp. (TSE:AQN.TO) Seasonal Chart
Advanced Micro Devices, Inc. (NASD:AMD) Seasonal Chart
BMO MSCI All Country World High Quality Index ETF (TSE:ZGQ.TO) Seasonal Chart
Vanguard Extended Market ETF (NYSE:VXF) Seasonal Chart
iShares Emerging Markets Local Currency Bond ETF (AMEX:LEMB) Seasonal Chart
Regions Financial Corp. (NYSE:RF) Seasonal Chart
The Markets
Stocks closed generally mixed on Friday as traders remained on edge following the selloff in the market during the session prior. The S&P 500 Index closed down by 0.05%, holding below previous support at the 20-day moving average (6794) and continuing to intersect with the 50-day moving average (6704) that was tested last Friday. The hourly chart shows an ongoing “twitchiness” that has sprinkled the chart with gaps. Yet another was opened on Friday between 6705 and 6724 that was quickly filled throughout the session. The benchmark is presently holding around the lower-limit of Monday’s upside gap between 6730 and 6785, so far stemming the tide of recent selling pressures. As has been pointed out in our work, there is reason to not expect much of equity market performance at this time of year through the middle of November, but the November 20th date to look to for the start of the next leg higher in the equity market in approaching in the week ahead. Using the weakness to ramp up risk exposure in portfolios for the end of year strength is seen as prudent. Downside risks in the very near term continue to be toward the 20-week moving average at 6531. We continue to lean heavily on our list of candidates in the market that are worthy to Accumulate or Avoid, which continues to show far more ideas worthy to buy than to sell.
Today, in our Market Outlook to subscribers, we discuss the following:
- Weekly look at the large-cap benchmark
- Canada Manufacturing Sales and what is driving the record setting September rise
- Health Care rotation
- Canadian Auto Parts
- AI Infrastructure buildout beneficiaries
- Energy Sector
Subscribers can look for this report in their inbox or by clicking on the following link and logging in: Market Outlook for November 17
Not signed up yet? Subscribe now to receive full access to all of the research and analysis that we publish
Sentiment on Friday, as gauged by the put-call ratio, ended slightly bullish at 0.91.
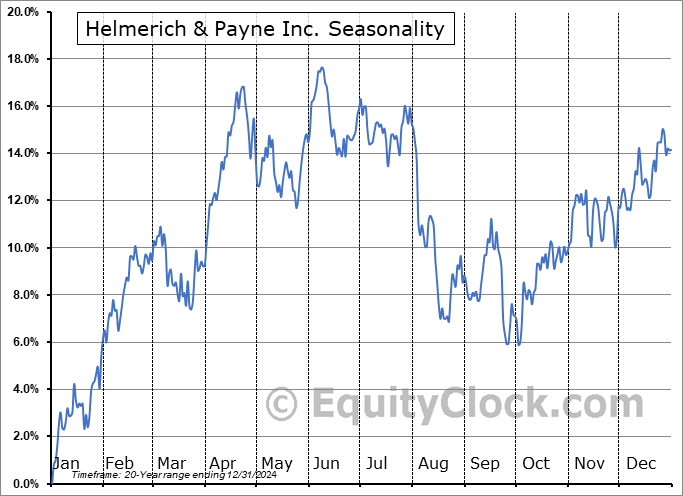
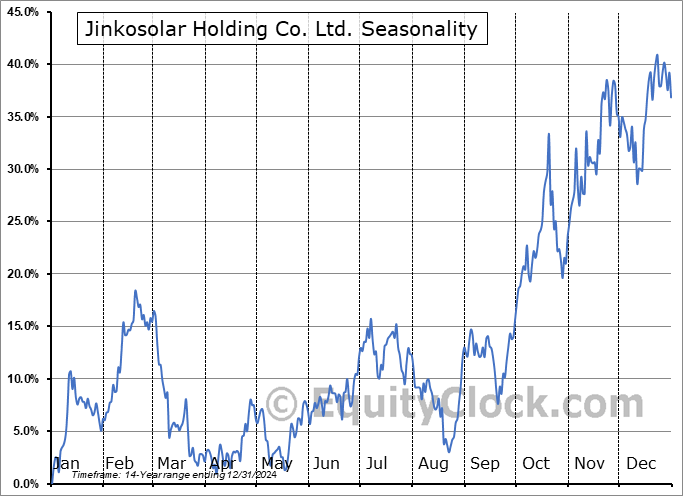
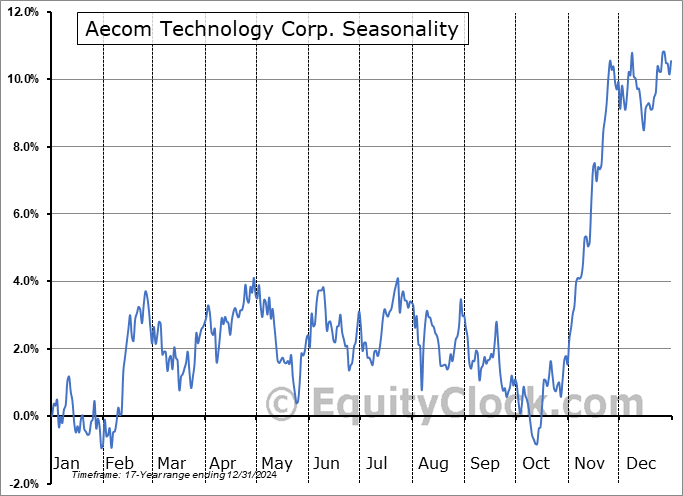
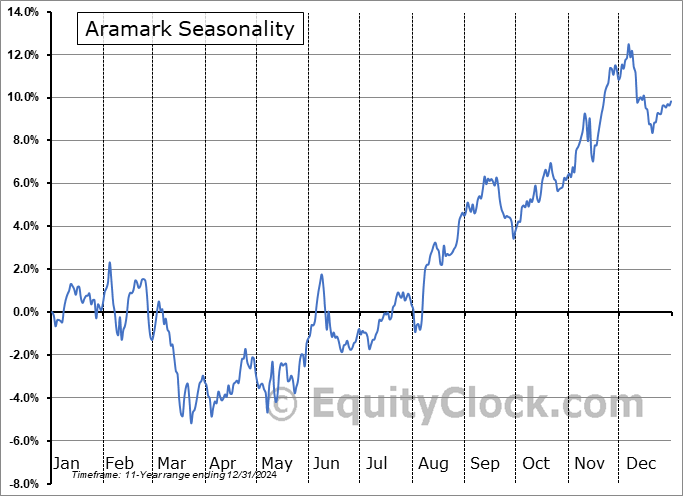
Seasonal charts of companies reporting earnings today:
S&P 500 Index
TSE Composite

| Sponsored By... |

|


