Stock Market Outlook for November 18, 2025

Indecision in the market is readily apparent, but the next ramp in equity prices from a seasonal perspective is nearing.
*** Stocks highlighted are for information purposes only and should not be considered as advice to purchase or to sell mentioned securities. As always, the use of technical and fundamental analysis is encouraged in order to fine tune entry and exit points to average seasonal trends.
Stocks Entering Period of Seasonal Strength Today:
Subscribers Click on the relevant link to view the full profile. Not a subscriber? Signup here.
Clough Global Dividend and Income Fund (AMEX:GLV) Seasonal Chart
Cemex SA (NYSE:CX) Seasonal Chart
Interfor Corp. (TSE:IFP.TO) Seasonal Chart
NorthWestern Corp. (NASD:NWE) Seasonal Chart
Darling Ingredients Inc. (NYSE:DAR) Seasonal Chart
Smith and Nephew PLC (NYSE:SNN) Seasonal Chart
Acadian Timber Corp. (TSE:ADN.TO) Seasonal Chart
Barrick Gold Corp. (TSE:ABX.TO) Seasonal Chart
CGI Inc. (NYSE:GIB) Seasonal Chart
iShares S&P/TSX Global Gold Index ETF (TSE:XGD.TO) Seasonal Chart
Ares Dynamic Credit Allocation Fund, Inc. (NYSE:ARDC) Seasonal Chart
The Markets
Stocks closed down to start the week as scrutiny over many of the growth/AI technology plays, as well as the loans that that fuelled their expansion, had investors continuing to rebalance their books away from overweight bets. The S&P 500 Index closed down by 0.92%, closing below its 50-day moving average (6707) for the first time since April. Support at the November 7th low around 6640 is being tested. Reaction to the two important zones of gap resistance continues to be seen (~6760 and ~6830), providing hurdles that short-term traders have been using to peg negative bets against. As has been pointed out in our work, there is reason to not expect much of equity market performance at this time of year through the middle of November, but the November 20th date to look to for the start of the next leg higher in the equity market in approaching in the days ahead. Using the weakness to ramp up risk exposure in portfolios for the end of year strength is seen as prudent. Downside risks in the very near term continue to be toward the 20-week moving average at 6551. We continue to lean heavily on our list of candidates in the market that are worthy to Accumulate or Avoid, which continues to show far more ideas worthy to buy than to sell.
Want to know which areas of the market to buy or sell? Our Weekly Chart Books have just been updated, providing a clear Accumulate, Avoid, or Neutral rating for currencies, cryptocurrencies, commodities, broad markets, and subsectors/industries of the market. Subscribers can login and click on the relevant links to access.
- Currencies
- Cryptocurrencies
- Commodities
- Major Benchmarks
- Sub-sectors / Industries
- ETFs: Bonds | Commodities | Equity Markets | Industries | Sectors
Subscribe now.
Today, in our Market Outlook to subscribers, we discuss the following:
- Our weekly chart books update, along with our list of all segments of the market to either Accumulate or Avoid
- Other Notes
Subscribers can look for this report in their inbox or by clicking on the following link and logging in: Market Outlook for November 18
Not signed up yet? Subscribe now to receive full access to all of the research and analysis that we publish
Sentiment on Monday, as gauged by the put-call ratio, ended close to neutral at 0.96.
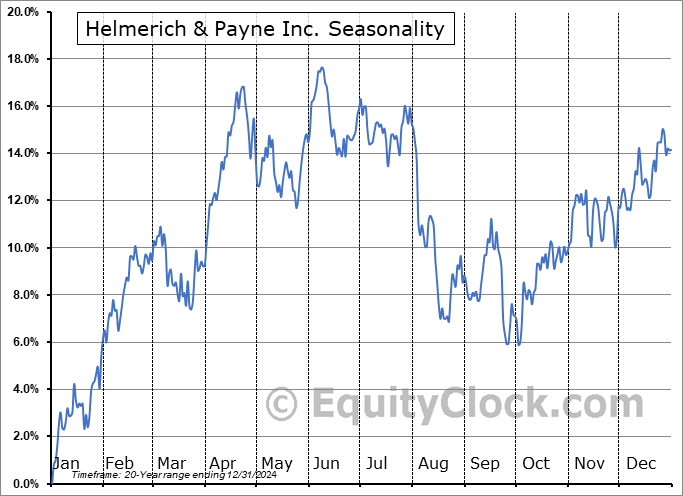
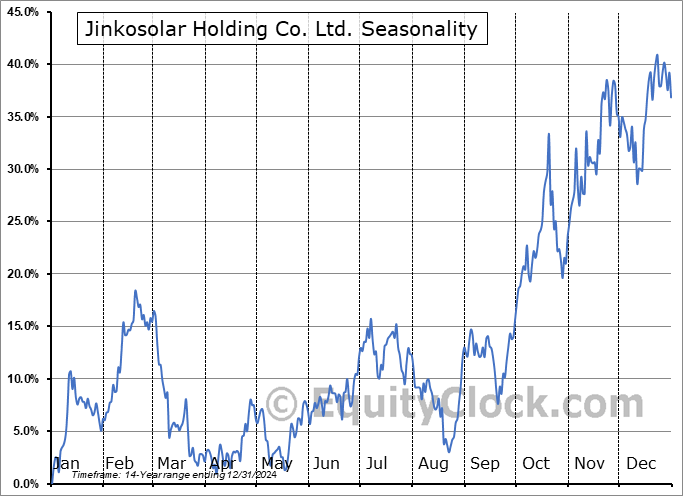
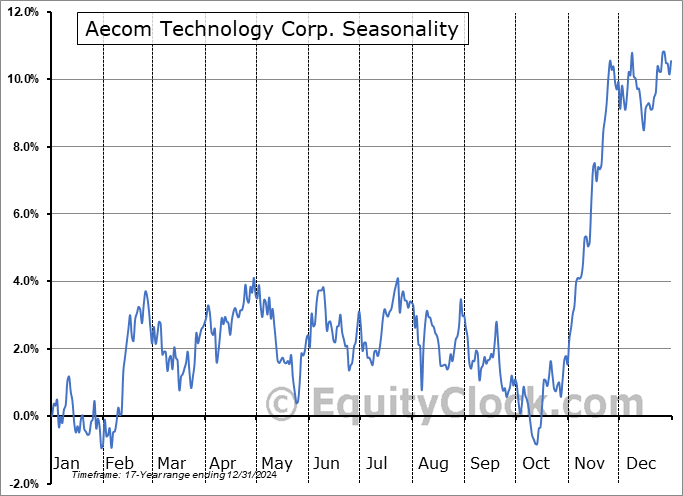
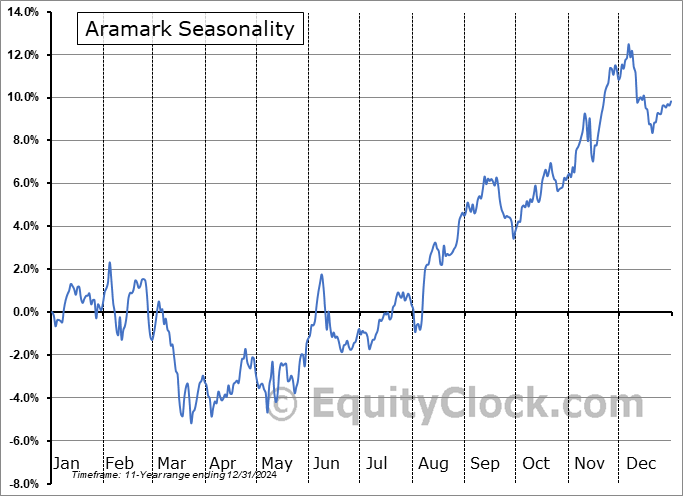
Seasonal charts of companies reporting earnings today:
S&P 500 Index
TSE Composite
| Sponsored By... |

|


