Stock Market Outlook for November 19, 2025

Market is showing the appearance of having greater respect for levels of resistance than levels of support.
*** Stocks highlighted are for information purposes only and should not be considered as advice to purchase or to sell mentioned securities. As always, the use of technical and fundamental analysis is encouraged in order to fine tune entry and exit points to average seasonal trends.
Stocks Entering Period of Seasonal Strength Today:
Subscribers Click on the relevant link to view the full profile. Not a subscriber? Signup here.

enCore Energy Corp. (NASD:EU) Seasonal Chart

iShares S&P Small-Cap 600 Value ETF (NYSE:IJS) Seasonal Chart

iShares Micro-Cap ETF (NYSE:IWC) Seasonal Chart
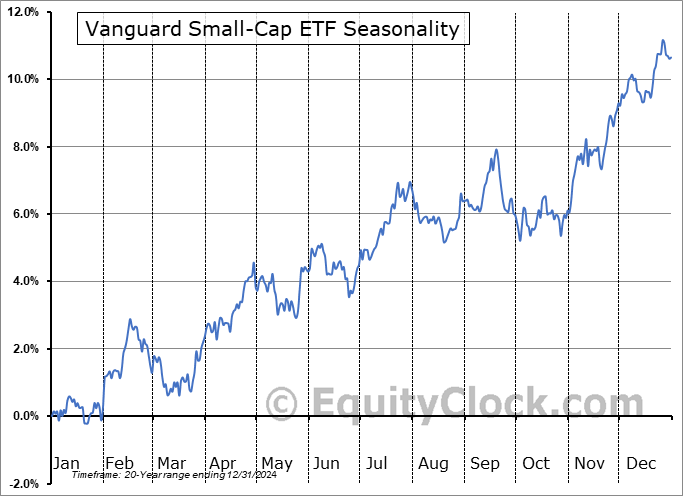
Vanguard Small-Cap ETF (NYSE:VB) Seasonal Chart

Mega Matrix Corp. (AMEX:MPU) Seasonal Chart

Himax Technologies Inc. (NASD:HIMX) Seasonal Chart

Sherritt Intl Corp. (TSE:S.TO) Seasonal Chart

iShares U.S. Real Estate ETF (NYSE:IYR) Seasonal Chart

Parkland Fuel Corp. (TSE:PKI.TO) Seasonal Chart

Mohawk Inds, Inc. (NYSE:MHK) Seasonal Chart

Gentherm Inc. (NASD:THRM) Seasonal Chart
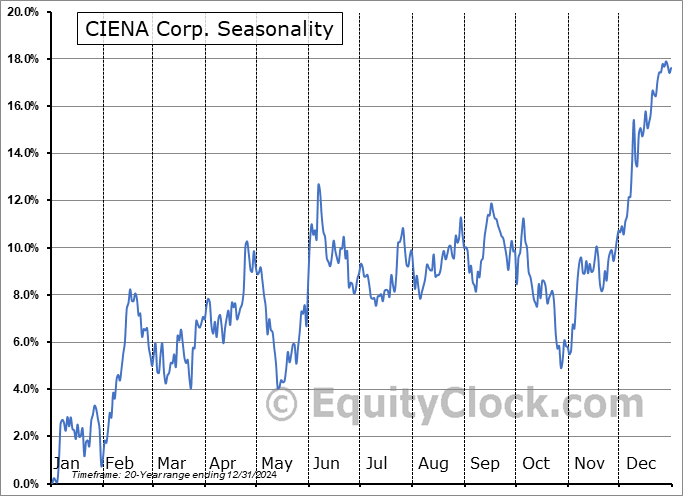
CIENA Corp. (NYSE:CIEN) Seasonal Chart

Moelis & Co. (NYSE:MC) Seasonal Chart
The Markets
Stocks closed largely mixed on Tuesday as funds continue to rotate out of overweight technology holdings and towards many of this year’s laggards to which portfolios have been underweight (eg. health care, staples, energy). The S&P 500 Index closed down by 0.83%, charting a doji indecision candlestick below its 50-day moving average (6710) that was broken on Monday. Support at the November 7th low around 6640 has been broken and, all of a sudden, the market is providing the appearance of having greater respect to levels of resistance than levels of support. Reaction to the two important zones of gap resistance continues to be seen (~6760 and ~6830), providing hurdles that short-term traders have been using to peg negative bets against. As has been pointed out in our work, there is reason to not expect much of equity market performance at this time of year through the middle of November, but the November 20th date to look to for the start of the next leg higher in the equity market is approaching in the days ahead. This weakness that the market is experiencing is very much welcomed as we have not fallen victim to buying on the date of the average start to the best six months of the year that other strict seasonal managers have done, providing us with the opportunity to increase exposure to risk aggresivly when it is logical from a technical perspective to do so. Downside risks in the very near term continue to be toward the 20-week moving average at 6549, a variable hurdle that came close to being tested at the lows of Tuesday’s session. We continue to lean heavily on our list of candidates in the market that are worthy to Accumulate or Avoid, which continues to show far more ideas worthy to buy than to sell.


Today, in our Market Outlook to subscribers, we discuss the following:
- The head-and-shoulders topping pattern that has been carved out in the Financial Sector
- Small-Caps
- Canada Consumer Price Index (CPI) and the investment implications within
Subscribers can look for this report in their inbox or by clicking on the following link and logging in: Market Outlook for November 19
Not signed up yet? Subscribe now to receive full access to all of the research and analysis that we publish
Sentiment on Tuesday, as gauged by the put-call ratio, ended slightly bullish at 0.91.

Seasonal charts of companies reporting earnings today:


S&P 500 Index


TSE Composite


| Sponsored By... |

|


