Stock Market Outlook for December 3, 2025

Potential alleviation of a significant headwind against stocks as cryptocurrencies attempt double-bottom lows.
*** Stocks highlighted are for information purposes only and should not be considered as advice to purchase or to sell mentioned securities. As always, the use of technical and fundamental analysis is encouraged in order to fine tune entry and exit points to average seasonal trends.
Stocks Entering Period of Seasonal Strength Today:
Subscribers Click on the relevant link to view the full profile. Not a subscriber? Signup here.

Alta Equipment Group Inc (NYSE:ALTG) Seasonal Chart

Docusign, Inc. (NASD:DOCU) Seasonal Chart

Middlefield Real Estate Dividend ETF (TSE:MREL.TO) Seasonal Chart

Gunnison Copper Corp. (TSE:GCU.TO) Seasonal Chart

Russel Metals, Inc. (TSE:RUS.TO) Seasonal Chart

Denison Mines Corp. (TSE:DML.TO) Seasonal Chart
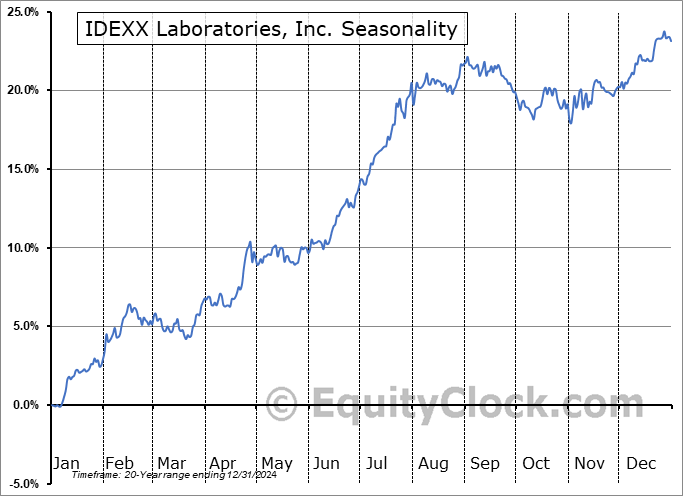
IDEXX Laboratories, Inc. (NASD:IDXX) Seasonal Chart

Advanced Energy Industries, Inc. (NASD:AEIS) Seasonal Chart

SAIA Inc. (NASD:SAIA) Seasonal Chart

Freshpet Inc. (NASD:FRPT) Seasonal Chart

Dream Industrial REIT (TSE:DIR/UN.TO) Seasonal Chart

iShares MSCI China ETF (NASD:MCHI) Seasonal Chart

North Arrow Minerals Inc. (TSXV:NAR.V) Seasonal Chart
The Markets
Stocks edged higher on Tuesday as traders bought back into Technology stocks that had been beaten down since the end of October. The S&P 500 Index gained a quarter of one percent, gyrating within the bounds of the gap that was originally opened on October 27th around 6830. Previous gap resistance at 6770 continues to be looked to as support. The market has been proving that it is no longer showing greater respect to levels of resistance than to levels of support, at least on an ultra-short-term timescale, but the hurdles overhead are major nuts to crack and require broader participation to definitively break. The major threshold on the upside to scrutinize is, quite obviously, the all-time high at 6920 that was charted at the end of October. The bears continue to contend with positive seasonality for this time of year with gains the norm for market benchmarks in December, but a softer period on the calendar through the first half of December following the strong end of November performance would be reasonable to fuel digestion of recent strength. As we have been emphasizing, the 20-week moving average (now around 6600) has been the desired risk-reward point to adding new risk exposure to portfolios and the large-cap benchmark tested this point a week ago Thursday. So far, everything is playing out well according to our playbook and our list of candidates in the market that are worthy to Accumulate or Avoid continues to provide ideas on how to position in this market that has become fairly volatile in recent weeks.


Today, in our Market Outlook to subscribers, we discuss the following:
- Rebound in the cryptocurrency market
- Seasonal trade in Natural Gas as the weather gets colder
- Playing Palladium through the end of the year
Subscribers can look for this report in their inbox or by clicking on the following link and logging in: Market Outlook for December 3
Not signed up yet? Subscribe now to receive full access to all of the research and analysis that we publish
Sentiment on Tuesday, as gauged by the put-call ratio, ended bullish at 0.78.

Seasonal charts of companies reporting earnings today:


S&P 500 Index


TSE Composite


| Sponsored By... |

|


