Stock Market Outlook for December 10, 2025

Job openings and hires suggesting a cyclical tilt emerging and we want to be there for it.
*** Stocks highlighted are for information purposes only and should not be considered as advice to purchase or to sell mentioned securities. As always, the use of technical and fundamental analysis is encouraged in order to fine tune entry and exit points to average seasonal trends.
Stocks Entering Period of Seasonal Strength Today:
Subscribers Click on the relevant link to view the full profile. Not a subscriber? Signup here.

Acme United Corp. (AMEX:ACU) Seasonal Chart
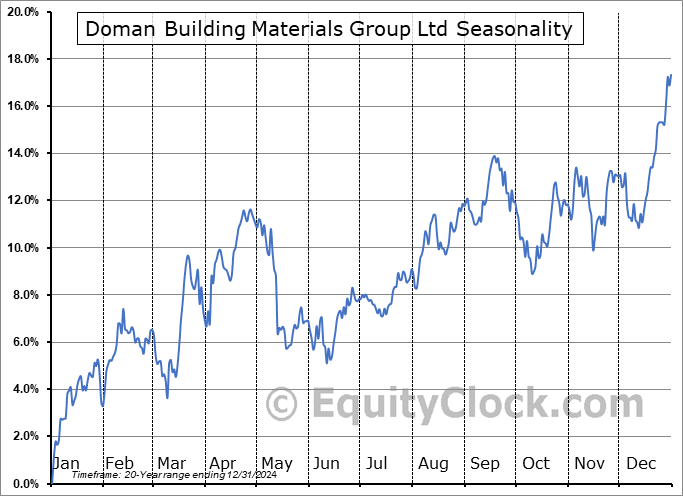
Doman Building Materials Group Ltd (TSE:DBM.TO) Seasonal Chart

ACM Research, Inc. (NASD:ACMR) Seasonal Chart

Premium Brands Holdings Corp. (TSE:PBH.TO) Seasonal Chart

Bridgemarq Real Estate Services Inc (TSE:BRE.TO) Seasonal Chart

Copper Fox Metals, Inc. (TSXV:CUU.V) Seasonal Chart

Taseko Mines Ltd. (AMEX:TGB) Seasonal Chart

iShares MSCI Emerging Markets Small-Cap ETF (AMEX:EEMS) Seasonal Chart
Disclaimer: Comments and opinions offered in this report are for information only. They should not be considered as advice to purchase or to sell mentioned securities. Data offered is believed to be accurate, but is not guaranteed.
Note to subscribers using Yahoo or AOL emails: In the past 24 hours, our reports that we have sent to subscribers using these email services bounced for reasons that are not immediately clear. We have escalated the issue to our deliverability team, who are presently investigating the issue. We apologize for any inconvenience that may be resulting. In the meantime, subscribers affected can access these recent reports via the report archive located on the home page of the Chart Database.
The Markets
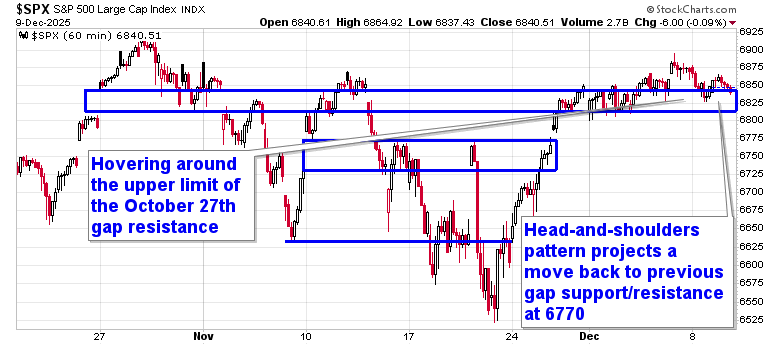
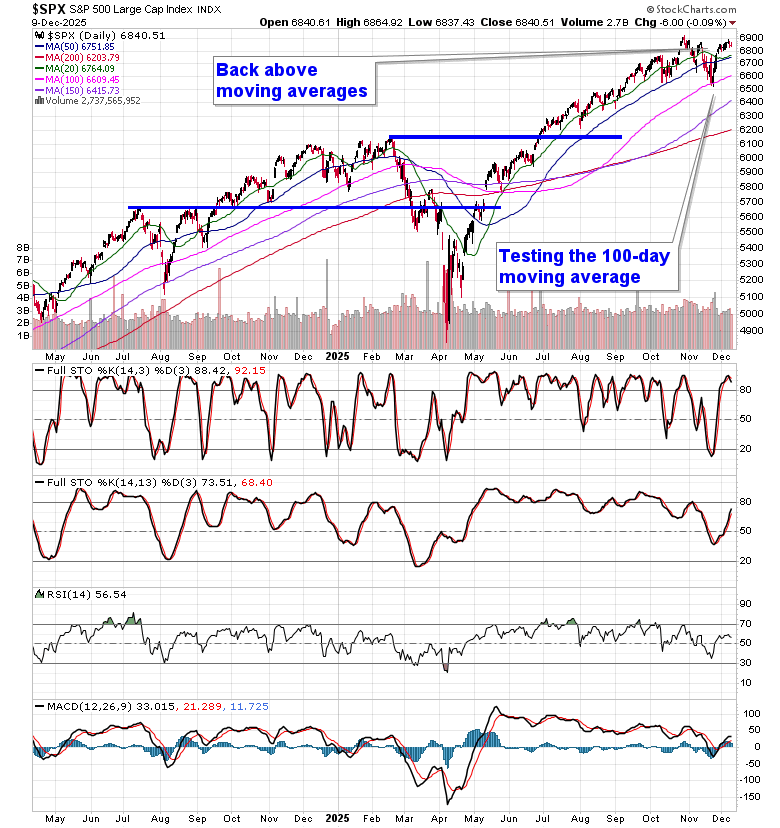
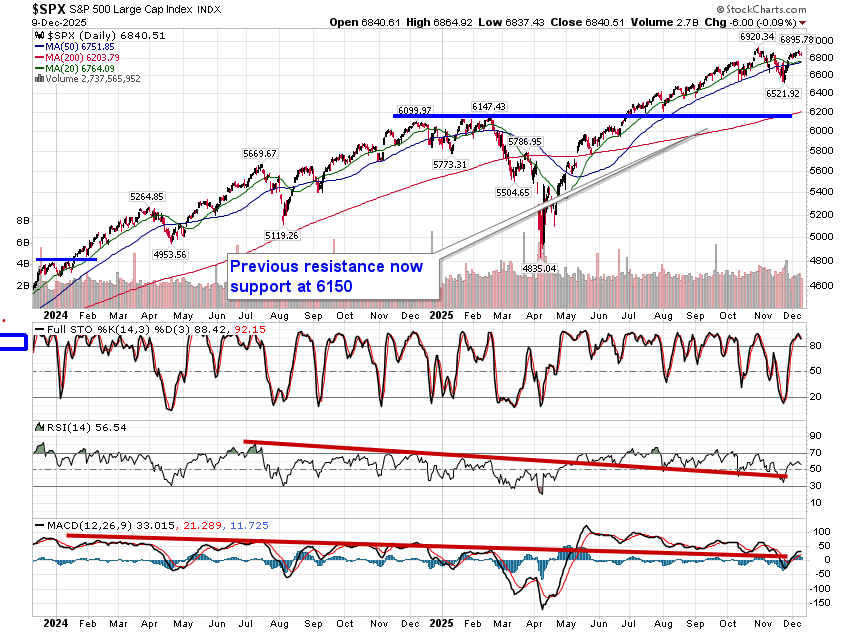
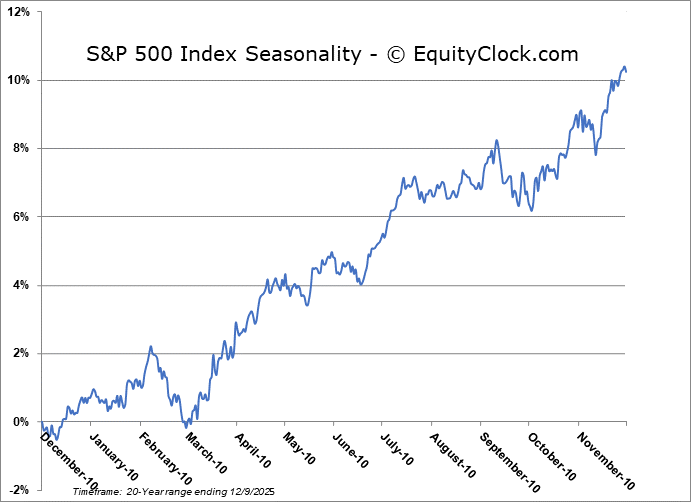
Stocks closed mixed on Tuesday as investors await the outcome of the Fed meeting on Wednesday. The S&P 500 Index drifted lower by a tenth of one percent, reaching back into the range of the gap that was originally opened on October 27th around 6830. A very short-term head-and-shoulders pattern offers the potential to see previous gap resistance at 6770 revisited in the days ahead. The market has been proving that it is no longer showing greater respect to levels of resistance than to levels of support, at least on an ultra-short-term timescale, but the hurdles overhead are major nuts to crack and require broader participation to definitively break. The major threshold on the upside to scrutinize is, quite obviously, the all-time high at 6920 that was charted at the end of October. The bears continue to contend with positive seasonality for this time of year with gains the norm for market benchmarks in December, but a softer period on the calendar through the first half of December following the strong end of November performance has been sufficient to fuel digestion of recent strength. As we have been emphasizing, the 20-week moving average (now around 6630) has been the desired risk-reward point to adding new equity exposure to portfolios and the large-cap benchmark tested this point just over two weeks ago. So far, everything is playing out well according to our playbook and we continue to embrace the new themes that are emerging to invest in (refer to our list of candidates in the market that are worthy to Accumulate or Avoid for ideas on how to position).
Today, in our Market Outlook to subscribers, we discuss the following:
- The bottoming pattern in treasury yields and the risk it poses to stocks for the end-of-year rally
- Job Openings and Labor Turnover Survey (JOLTS) and the investment implications within
- The first increase in layoffs through the first 10 months of the year since 2008
Subscribers can look for this report in their inbox or by clicking on the following link and logging in: Market Outlook for December 10
Not signed up yet? Subscribe now to receive full access to all of the research and analysis that we publish
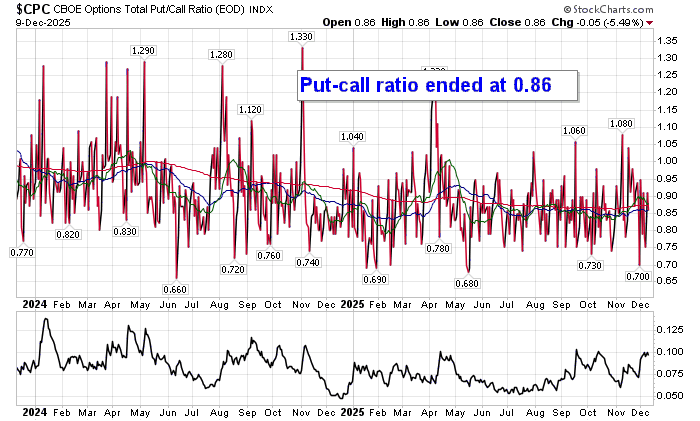
Sentiment on Tuesday, as gauged by the put-call ratio, ended bullish at 0.86.
Seasonal charts of companies reporting earnings today:


S&P 500 Index
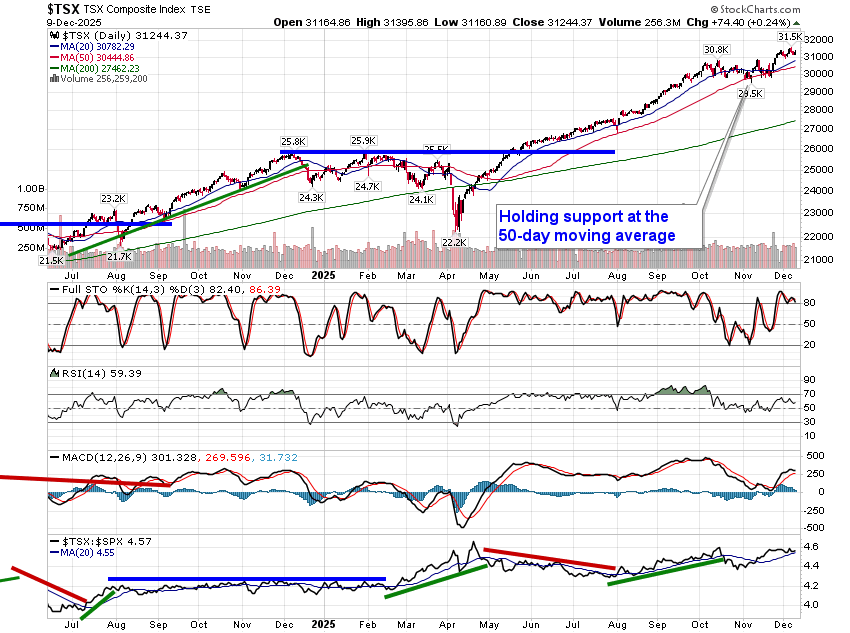
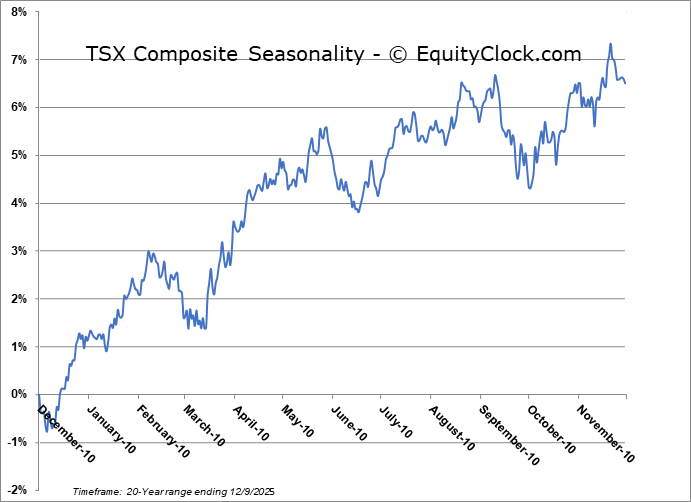
TSE Composite
| Sponsored By... |

|


