Stock Market Outlook for December 16, 2025

Positioning for the seasonally strong back half of December for stocks.
*** Stocks highlighted are for information purposes only and should not be considered as advice to purchase or to sell mentioned securities. As always, the use of technical and fundamental analysis is encouraged in order to fine tune entry and exit points to average seasonal trends.
Stocks Entering Period of Seasonal Strength Today:
Subscribers Click on the relevant link to view the full profile. Not a subscriber? Signup here.

iQIYI Inc. (NASD:IQ) Seasonal Chart

Aqua Metals, Inc. (NASD:AQMS) Seasonal Chart

Coterra Energy Inc. (NYSE:CTRA) Seasonal Chart

Frontier Lithium, Inc. (TSXV:FL.V) Seasonal Chart

DATA Communications Management Corp (TSE:DCM.TO) Seasonal Chart
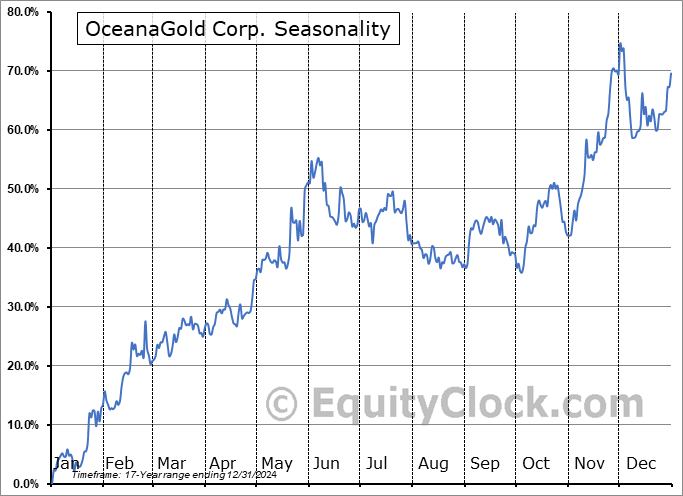
OceanaGold Corp. (TSE:OGC.TO) Seasonal Chart

Papa Johns Intl, Inc. (NASD:PZZA) Seasonal Chart

Canadian Natural Resources Ltd. (TSE:CNQ.TO) Seasonal Chart

Allegheny Technologies (NYSE:ATI) Seasonal Chart

iShares S&P/TSX Completion Index ETF (TSE:XMD.TO) Seasonal Chart

Cronos Group, Inc. (TSE:CRON.TO) Seasonal Chart

Blue Bird Corp. (NASD:BLBD) Seasonal Chart
Disclaimer: Comments and opinions offered in this report are for information only. They should not be considered as advice to purchase or to sell mentioned securities. Data offered is believed to be accurate, but is not guaranteed.
The Markets
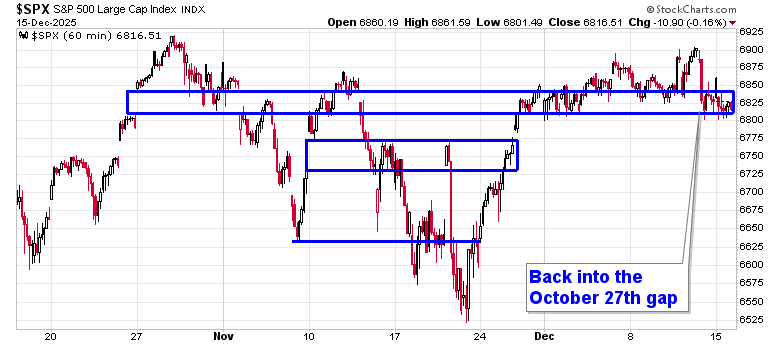
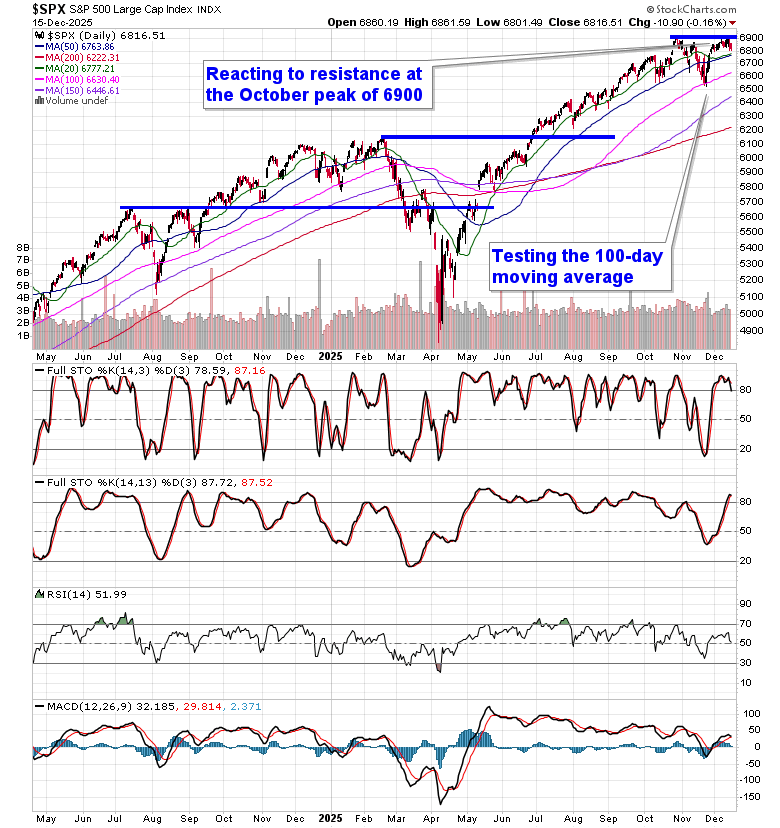
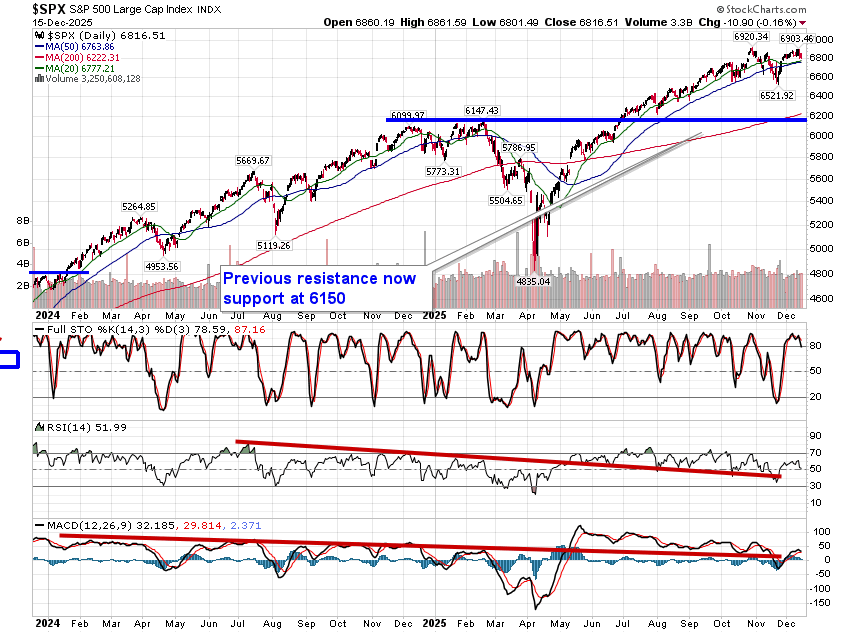
Stocks traded slightly lower on Monday as traders continue to step back from Technology sector exposure and wait for the release of delayed economic data through the days ahead. The S&P 500 Index shed 0.16%, remaining within the range of the gap that was originally opened on October 27th around 6830. This span of current support adds to the prior zone of gap support at 6770, a threshold that is still open to being tested before the notorious year-end seasonal positivity takes hold. Despite the slide recorded into the aforementioned span on Friday, the market continues to prove that it is no longer showing greater respect to levels of resistance than to levels of support, at least on an ultra-short-term timescale, and the likelihood is good that we will see the significant hurdles overhead attacked once into the Santa Claus Rally period that starts this week (according to our own definition of the holiday driven influence). The major threshold on the upside to scrutinize is, quite obviously, the all-time high at 6920 that was charted at the end of October; the risk of a double-top at this threshold is certainly apparent, but unlikely to materialize anything of substance until after the the positive seasonality for stocks at year-end. Perhaps with some uncertainty arising surrounding technology, so far everything is playing out well according to our playbook and we continue to embrace the new themes that are emerging to invest in (refer to our list of candidates in the market that are worthy to Accumulate or Avoid for ideas on how to position).
Want to know which areas of the market to buy or sell? Our Weekly Chart Books have just been updated, providing a clear Accumulate, Avoid, or Neutral rating for currencies, cryptocurrencies, commodities, broad markets, and subsectors/industries of the market. Subscribers can login and click on the relevant links to access.
- Currencies
- Cryptocurrencies
- Commodities
- Major Benchmarks
- Sub-sectors / Industries
- ETFs: Bonds | Commodities | Equity Markets | Industries | Sectors
Subscribe now.
Today, in our Market Outlook to subscribers, we discuss the following:
- Our weekly chart books update and our list of all segments of the market to either Accumulate or Avoid
- Other Notes
Subscribers can look for this report in their inbox or by clicking on the following link and logging in: Market Outlook for December 16
Not signed up yet? Subscribe now to receive full access to all of the research and analysis that we publish
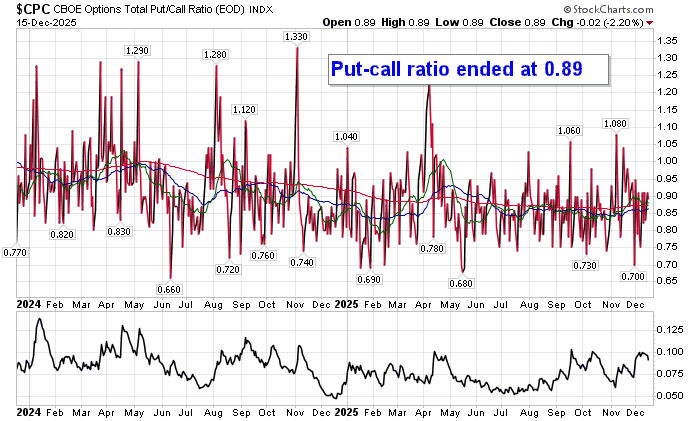
Sentiment on Monday, as gauged by the put-call ratio, ended bullish at 0.89.
Seasonal charts of companies reporting earnings today:


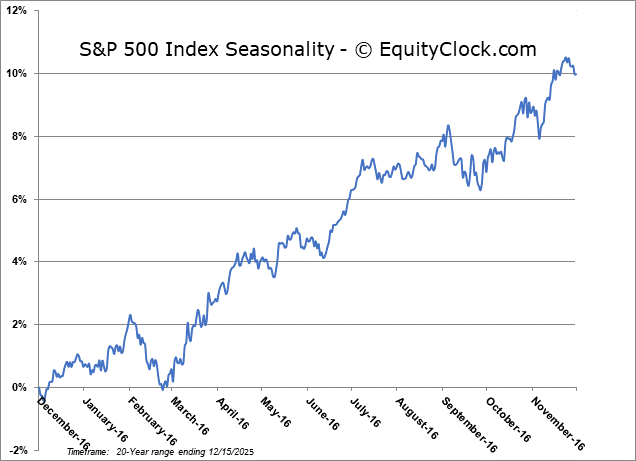
S&P 500 Index
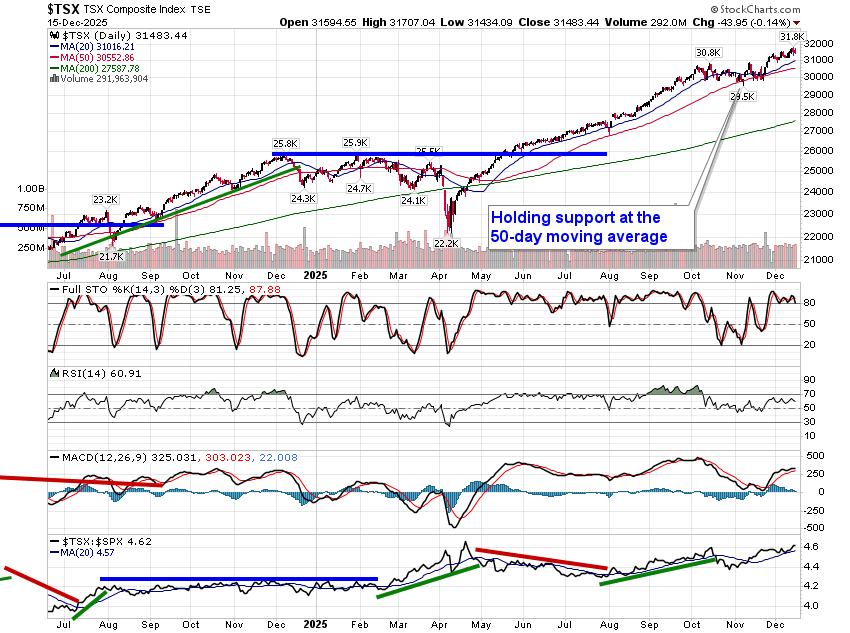
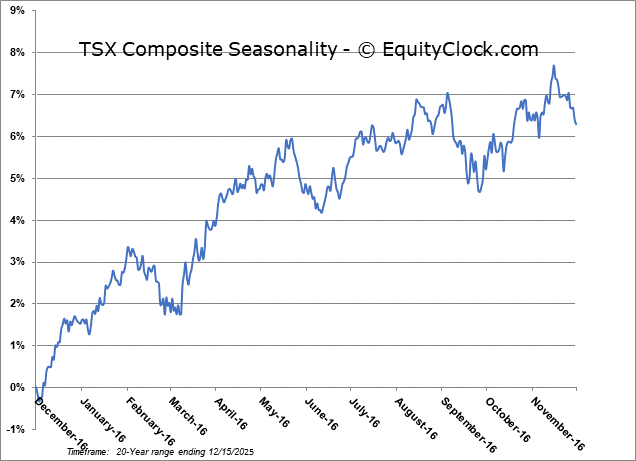
TSE Composite
| Sponsored By... |

|


