Stock Market Outlook for January 8, 2026

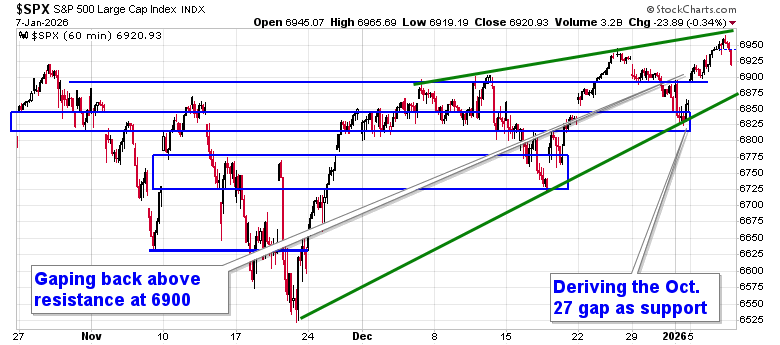
Short-term chart shows the S&P 500 Index trading within a narrowing rising range that ultimately culminates around the psychologically important 7000 level.
*** Stocks highlighted are for information purposes only and should not be considered as advice to purchase or to sell mentioned securities. As always, the use of technical and fundamental analysis is encouraged in order to fine tune entry and exit points to average seasonal trends.
Stocks Entering Period of Seasonal Strength Today:
Subscribers Click on the relevant link to view the full profile. Not a subscriber? Signup here.

Invesco Defensive Equity ETF (NYSE:POWA) Seasonal Chart

Hammond Manufacturing Co. Ltd. (TSE:HMM/A.TO) Seasonal Chart

Genie Energy Ltd. (NYSE:GNE) Seasonal Chart

Broadcom Inc. (NASD:AVGO) Seasonal Chart

Gran Tierra Energy, Inc. (AMEX:GTE) Seasonal Chart

Equity Lifestyle Properties, Inc. (NYSE:ELS) Seasonal Chart

Watsco, Inc. (NYSE:WSO) Seasonal Chart

Computer Modelling Group Ltd. (TSE:CMG.TO) Seasonal Chart

Netflix, Inc. (NASD:NFLX) Seasonal Chart
Disclaimer: Comments and opinions offered in this report are for information only. They should not be considered as advice to purchase or to sell mentioned securities. Data offered is believed to be accurate, but is not guaranteed.
The Markets
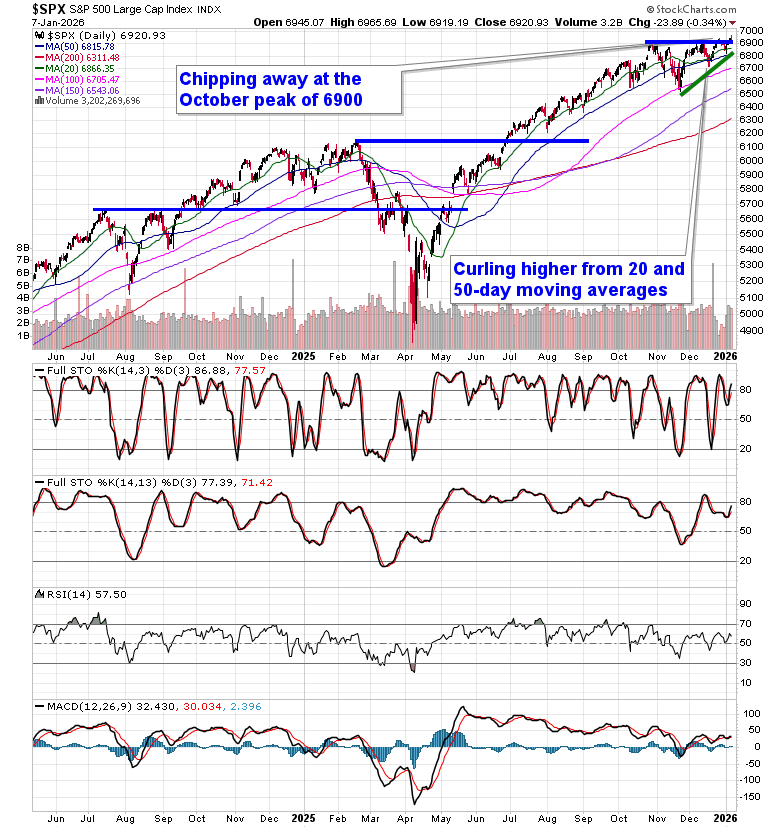
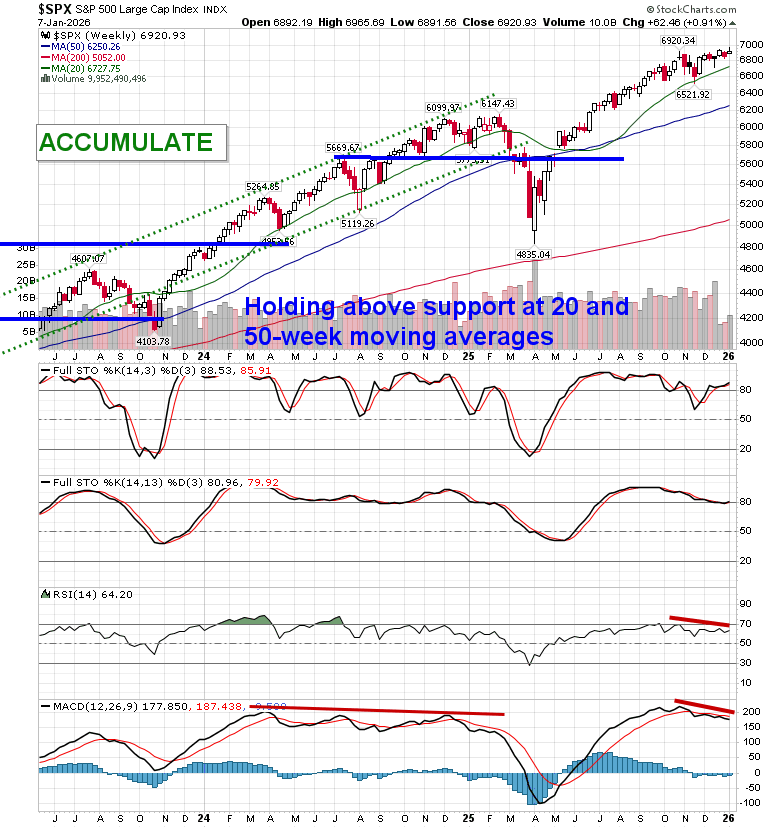
Stocks pulled back from the record highs on Wednesday now that the Santa Claus Rally period that peaked on January 6th has come to an end. The large-cap benchmark slipped by just over a third of one percent, remaining above horizontal resistance presented by the prior 52-week closing highs around 6900. End of October gap resistance has turned into support around 6830 and, until it is broken, playing on the long-side of this market remains appropriate. A narrowing range continues to be highlighted on the short-term chart, reaction to the upper limit of which played out on Wednesday; the lower limit can be pegged at 6875, presenting a near-term downside risk level. Ultimately, however, the narrowing span points to a culmination around the 7000 level, a psychologically important level that is presently acting as a draw. In the Seasonal Advantage Portfolio that we oversee at Castlemoore, we remain fully invested in the equity market and the themes in our chart books to either Accumulate or Avoid have been capturing the strength that has leached into the market from the November 20th lows.
Today, in our Market Outlook to subscribers, we discuss the following:
- Market Structure & Technical Backdrop
- Sector Action & Cyclical Leadership
- Broader Market Risk & Breadth Signals
- Labor Market: Cooling, Not Cracking
- Technology Losing Labor-Market Leadership
- Hiring Trends Signal Economic Rotation
- Quits & Layoffs: Key Recession Gauges
Subscribers can look for this report in their inbox or by clicking on the following link and logging in: Market Outlook for January 8
Not signed up yet? Subscribe now to receive full access to all of the research and analysis that we publish
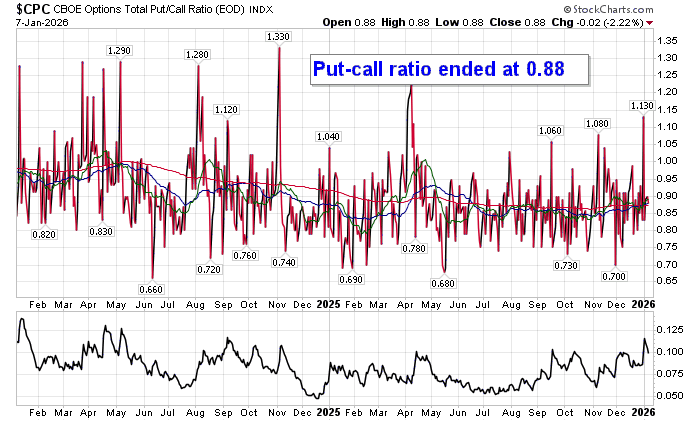
Investor sentiment on Wednesday, as gauged by the put-call ratio, ended bullish at 0.88.
Seasonal charts of companies reporting earnings today:


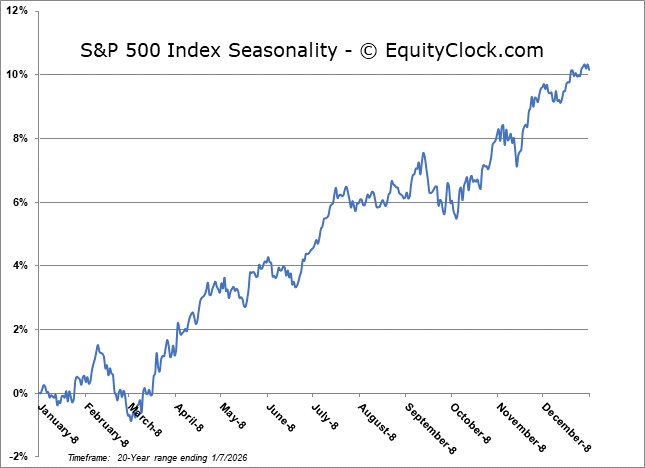
S&P 500 Index
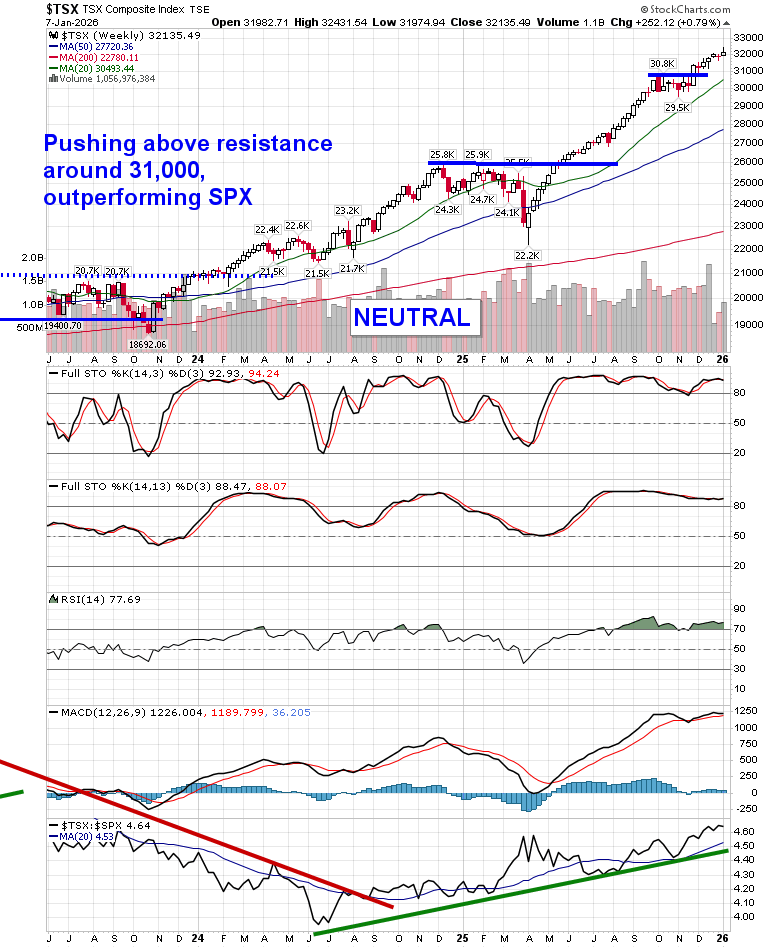
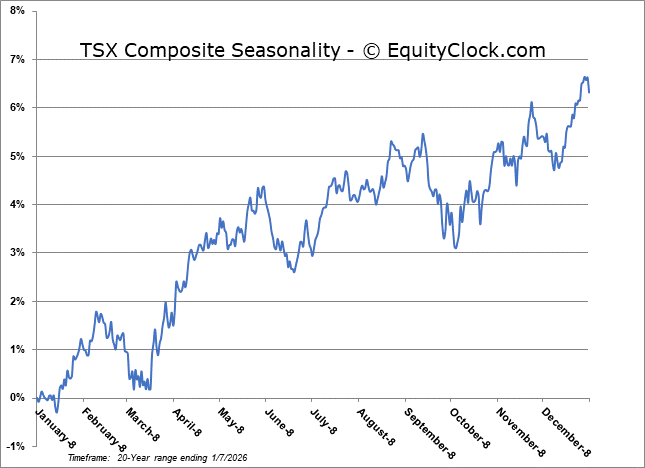
TSE Composite
| Sponsored By... |

|


