Stock Market Outlook for January 12, 2026

Climbing the Wall to 7000: Support Holds as Warning Signals Emerge
*** Stocks highlighted are for information purposes only and should not be considered as advice to purchase or to sell mentioned securities. As always, the use of technical and fundamental analysis is encouraged in order to fine tune entry and exit points to average seasonal trends.
Stocks Entering Period of Seasonal Strength Today:
Subscribers Click on the relevant link to view the full profile. Not a subscriber? Signup here.

Macy’s Inc. (NYSE:M) Seasonal Chart

Thomson Reuters Corp. (NYSE:TRI) Seasonal Chart

Companias Cervecerias (NYSE:CCU) Seasonal Chart

Invesco S&P 500 Equal Weight Consumer Staples ETF (NYSE:RSPS) Seasonal Chart

Colgate-Palmolive Co. (NYSE:CL) Seasonal Chart
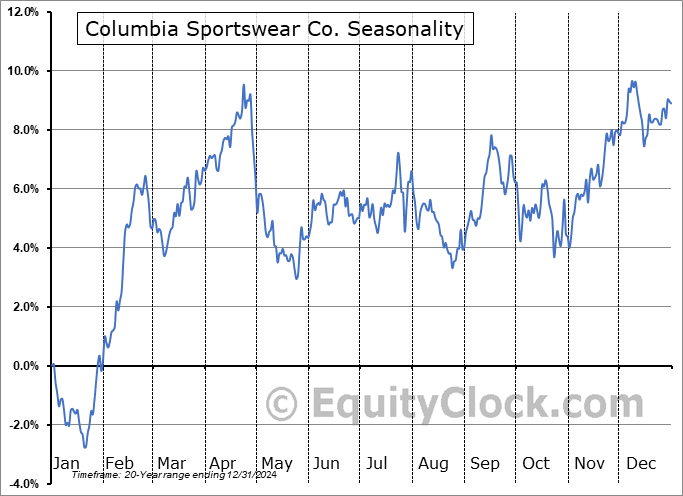
Columbia Sportswear Co. (NASD:COLM) Seasonal Chart
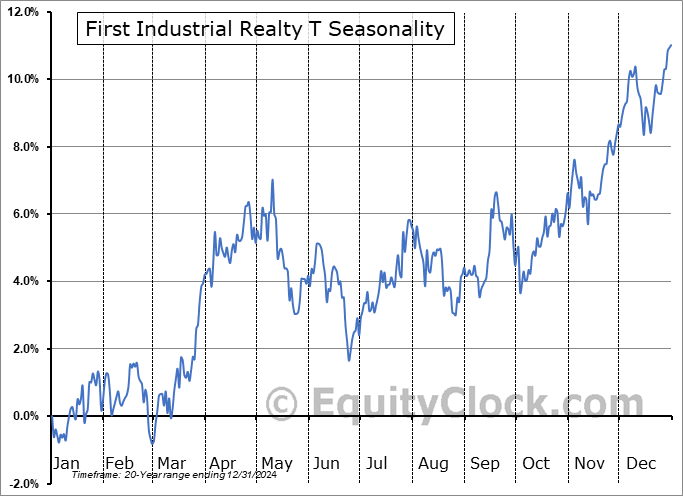
First Industrial Realty T (NYSE:FR) Seasonal Chart

Southwest Gas Corp. (NYSE:SWX) Seasonal Chart
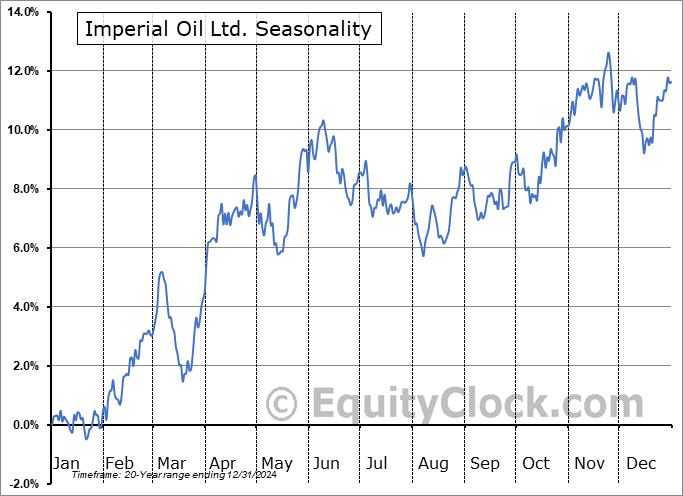
Imperial Oil Ltd. (TSE:IMO.TO) Seasonal Chart

Pembina Pipeline Corp. (NYSE:PBA) Seasonal Chart

ONE Gas Inc. (NYSE:OGS) Seasonal Chart

BMO Low Volatility Canadian Equity ETF (TSE:ZLB.TO) Seasonal Chart

Invesco DB Commodity Index Tracking Fund (NYSE:DBC) Seasonal Chart

United States Oil Fund, LP (NYSE:USO) Seasonal Chart
Disclaimer: Comments and opinions offered in this report are for information only. They should not be considered as advice to purchase or to sell mentioned securities. Data offered is believed to be accurate, but is not guaranteed.
The Markets
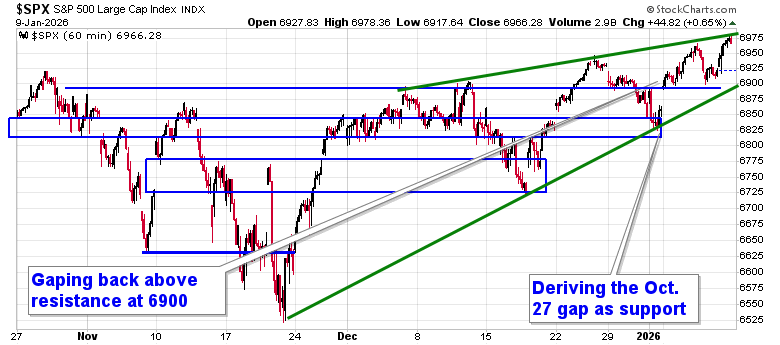
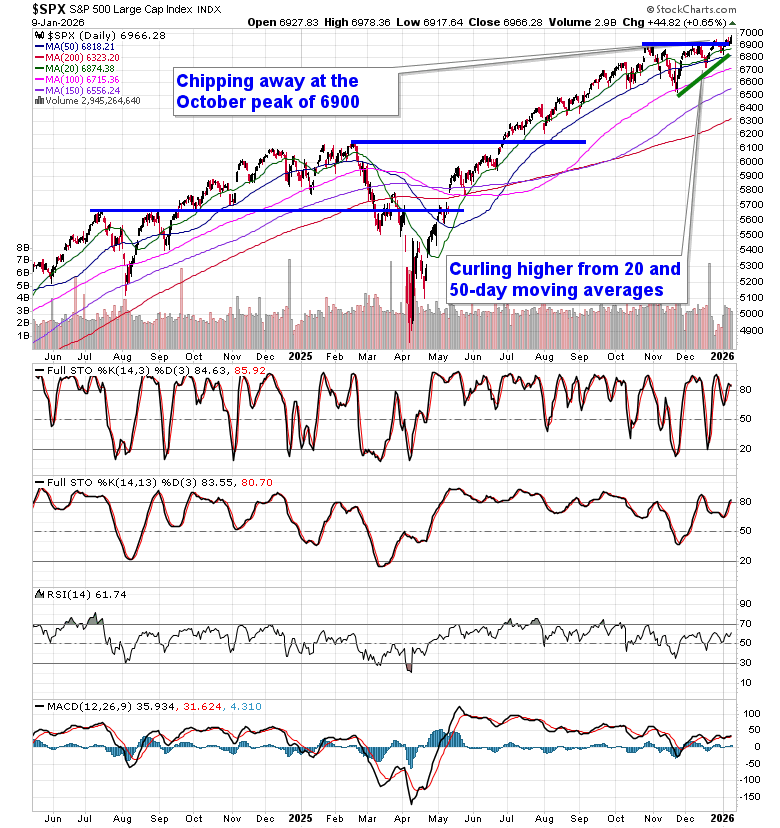
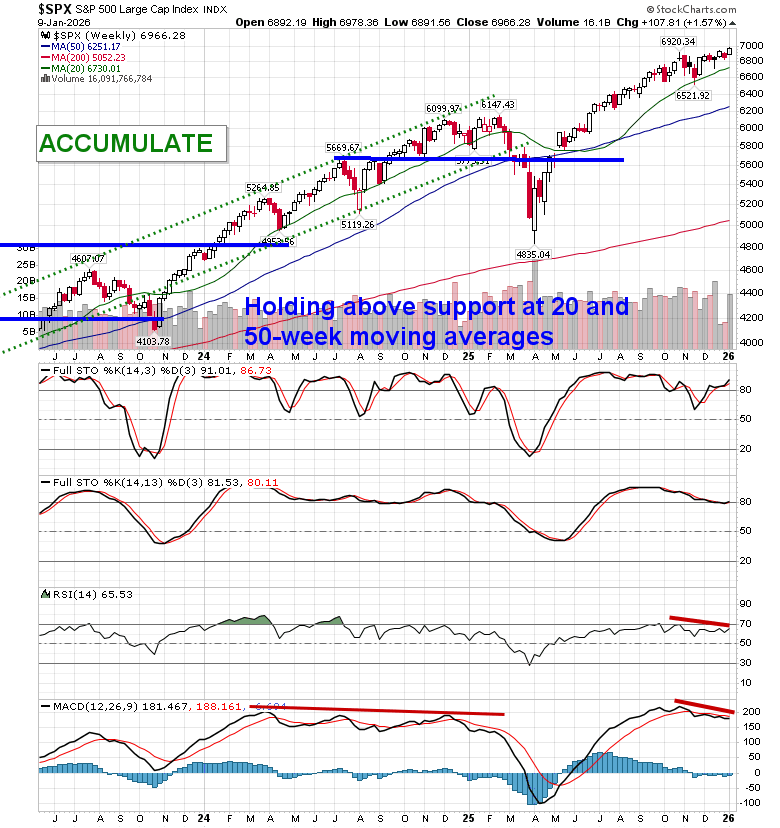
Stocks closed higher in the last session of the week as investors shook off concerns pertaining to a weaker than expected read of employment for the month of December. The large-cap benchmark closed with a gain of nearly two-thirds of one percent, remaining above horizontal resistance presented by the prior 52-week closing highs around 6900. End of October gap resistance continues to form new found support around 6830 and, until it is broken, playing on the long-side of this market remains appropriate. A narrowing range continues to be highlighted on the short-term chart, reaction to the upper limit was realized again into the close of Friday’s session; the lower limit can be pegged around 6895, presenting a near-term downside risk level. Ultimately, however, the narrowing span points to a culmination around the 7000 level, a psychologically important level that is presently acting as a draw. In the Seasonal Advantage Portfolio that we oversee at Castlemoore, we remain fully invested in the equity market and the themes in our chart books to either Accumulate or Avoid have been capturing the strength that has leached into the market from the November 20th lows.
Today, in our Market Outlook to subscribers, we discuss the following:
- Market Performance & Technical Setup
- Momentum & Risk Management Signals
- Sector Leadership & Positioning
- US Employment: Weak but Not Yet Recessionary
- Private Payrolls & Manufacturing Bright Spots
- Consumer Weakness Underlying Economic Trends
- Defensive Growth: Health Care
- Wages: Cooling Labor Power
- Canada: Mixed Labor Signals & Rotation Opportunities
- Canada REITs: Emerging Leadership
Subscribers can look for this report in their inbox or by clicking on the following link and logging in: Market Outlook for January 12
Not signed up yet? Subscribe now to receive full access to all of the research and analysis that we publish
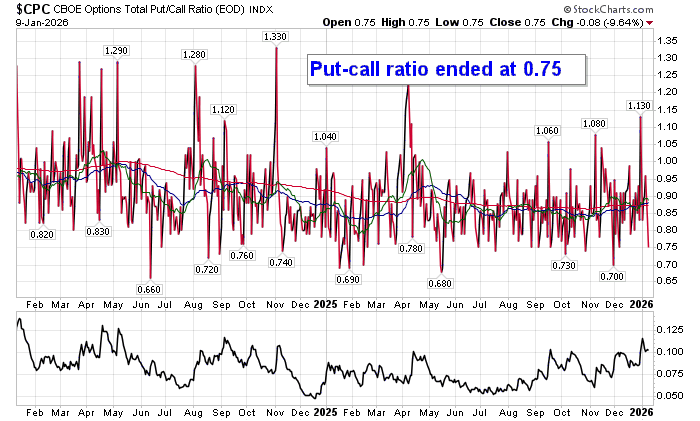
Sentiment on Friday, as gauged by the put-call ratio, ended bullish at 0.75.
Seasonal charts of companies reporting earnings today:
S&P 500 Index
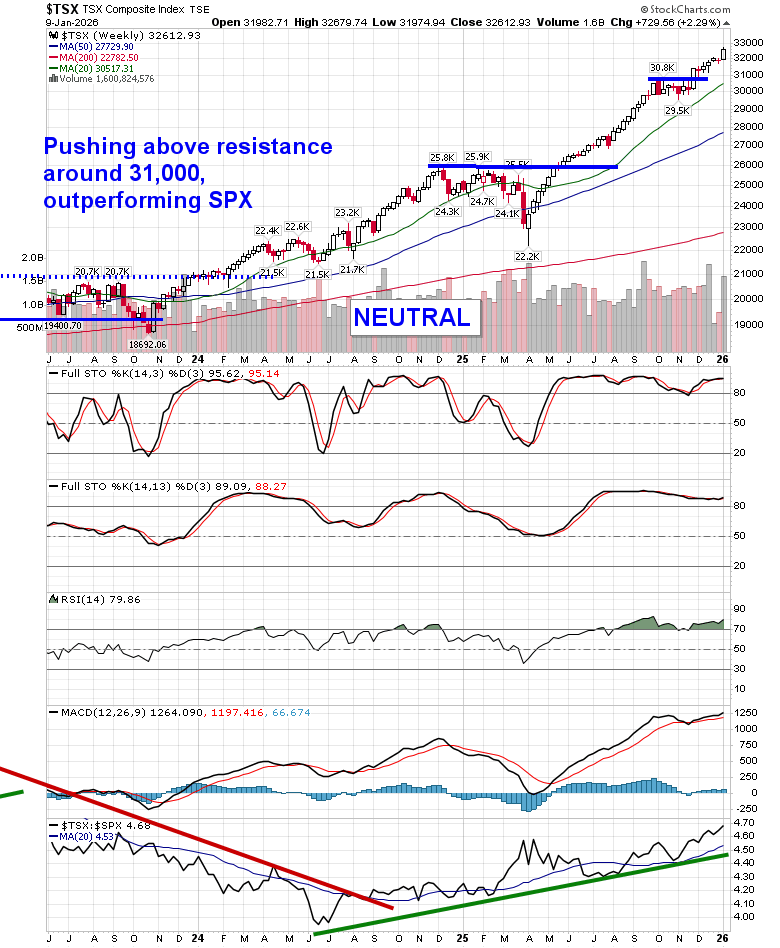
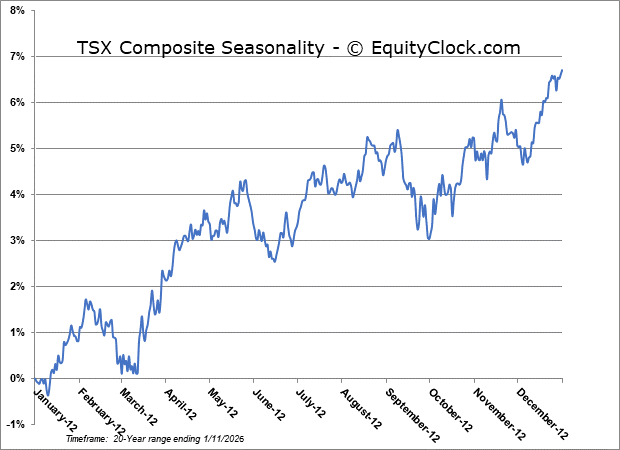
TSE Composite
| Sponsored By... |

|


