Stock Market Outlook for January 15, 2026

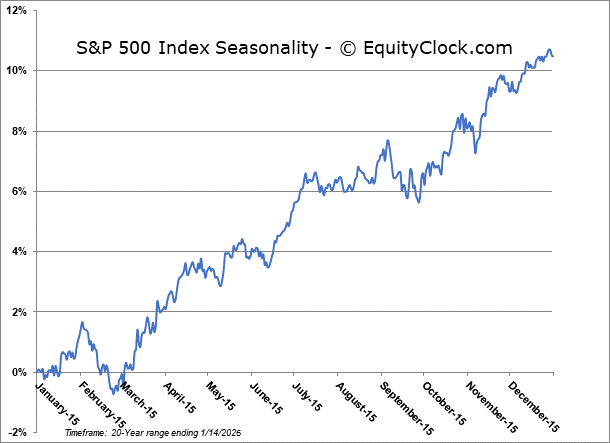
The market is fleeing growth/technology for value, a phenomenon that is quite normal at this time of year. We’ll tell you when to be on the lookout for growth opportunities ahead.
*** Stocks highlighted are for information purposes only and should not be considered as advice to purchase or to sell mentioned securities. As always, the use of technical and fundamental analysis is encouraged in order to fine tune entry and exit points to average seasonal trends.
Stocks Entering Period of Seasonal Strength Today:
Subscribers Click on the relevant link to view the full profile. Not a subscriber? Signup here.

Analog Devices, Inc. (NASD:ADI) Seasonal Chart

Pan American Silver Corp. (TSE:PAAS.TO) Seasonal Chart

Gamestop Corp. (NYSE:GME) Seasonal Chart

Chunghwa Telecom Co., Ltd. (NYSE:CHT) Seasonal Chart

Weibo Corp. (NASD:WB) Seasonal Chart

United States Brent Oil Fund (NYSE:BNO) Seasonal Chart
Disclaimer: Comments and opinions offered in this report are for information only. They should not be considered as advice to purchase or to sell mentioned securities. Data offered is believed to be accurate, but is not guaranteed.
The Markets
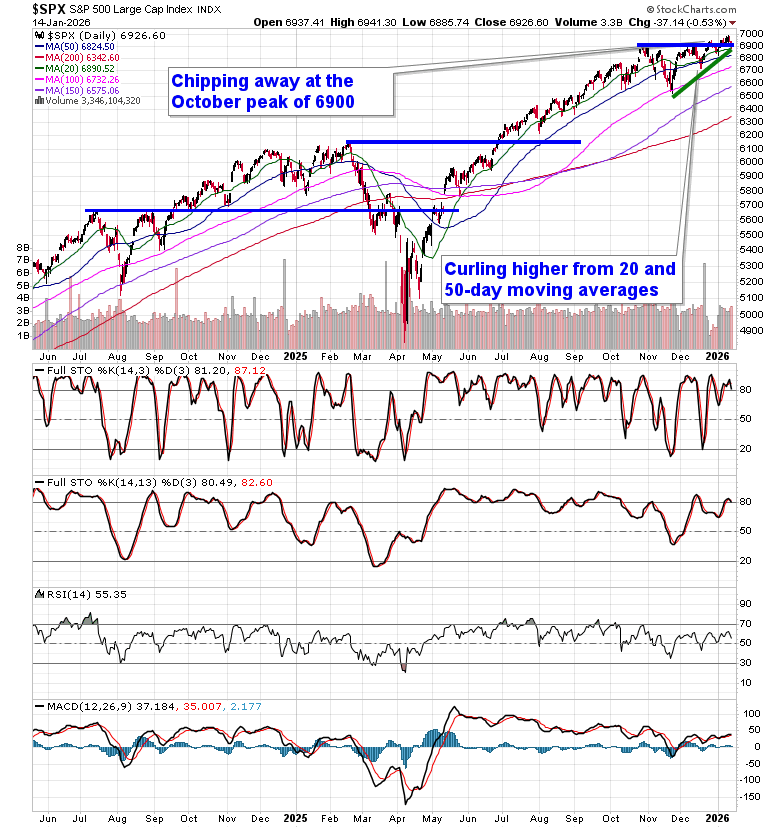
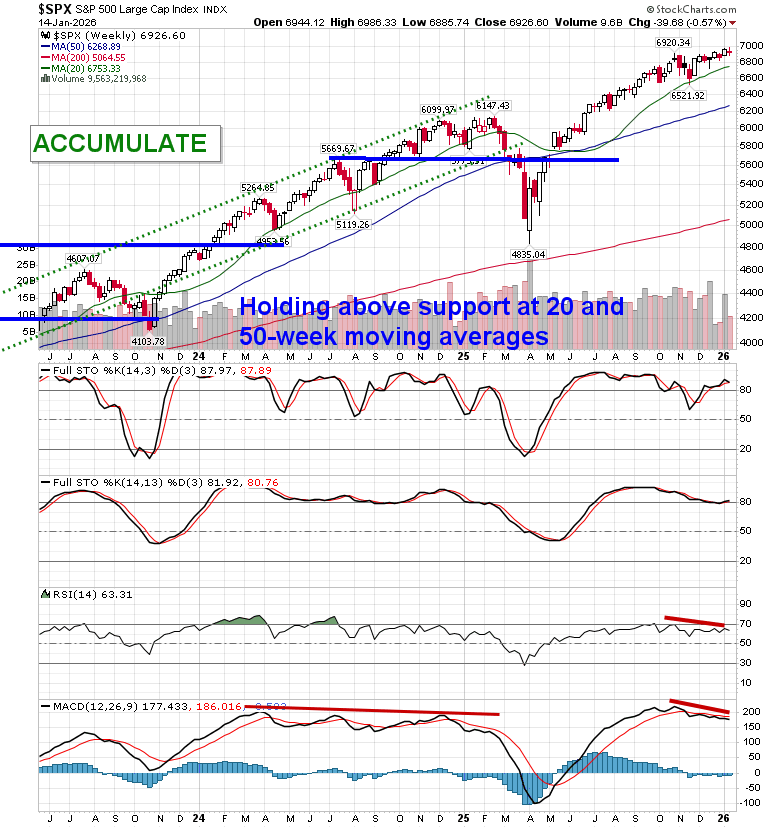
Stocks drifted lower for a second day as weakness in many of the growth names that flourished last year came under pressure. The large-cap benchmark closed down by around half of one percent, still managing to hold above horizontal resistance presented by the prior 52-week closing highs around 6900. End of October gap resistance continues to form new found support around 6830 and, until it is broken, playing on the long-side of this market remains appropriate. The lower limit of the narrowing range that we have presented was cracked during the Wednesday session, but it was not definitely broken given that the benchmark ended right on the lower limit of the span around 6925. Ultimately, however, the narrowing span points to a culmination around the 7000 level, a psychologically important level that is presently acting as a draw. In the Seasonal Advantage Portfolio that we oversee at Castlemoore, we remain fully invested in the equity market and the themes in our chart books to either Accumulate or Avoid have been capturing the strength that has leached into the market from the November 20th lows.

Today, in our Market Outlook to subscribers, we discuss the following:
- Market Structure & Technical Backdrop
- Leadership Rotation: Growth to Value
- Value Outperformance Has Further Runway
- Mid-Term Election Year Risk Framework: Examining the logical downside level for the S&P 500 should a correction commence
- Consumer Health & Retail Sales Warning Signs
- Housing Market: Activity vs. Pricing Divergence
Subscribers can look for this report in their inbox or by clicking on the following link and logging in: Market Outlook for January 15
Not signed up yet? Subscribe now to receive full access to all of the research and analysis that we publish
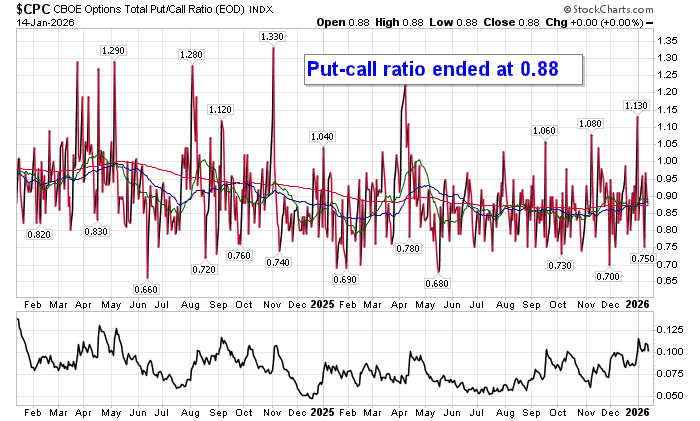
Investor sentiment on Wednesday, as gauged by the put-call ratio, ended bullish at 0.88.
Seasonal charts of companies reporting earnings today:


S&P 500 Index
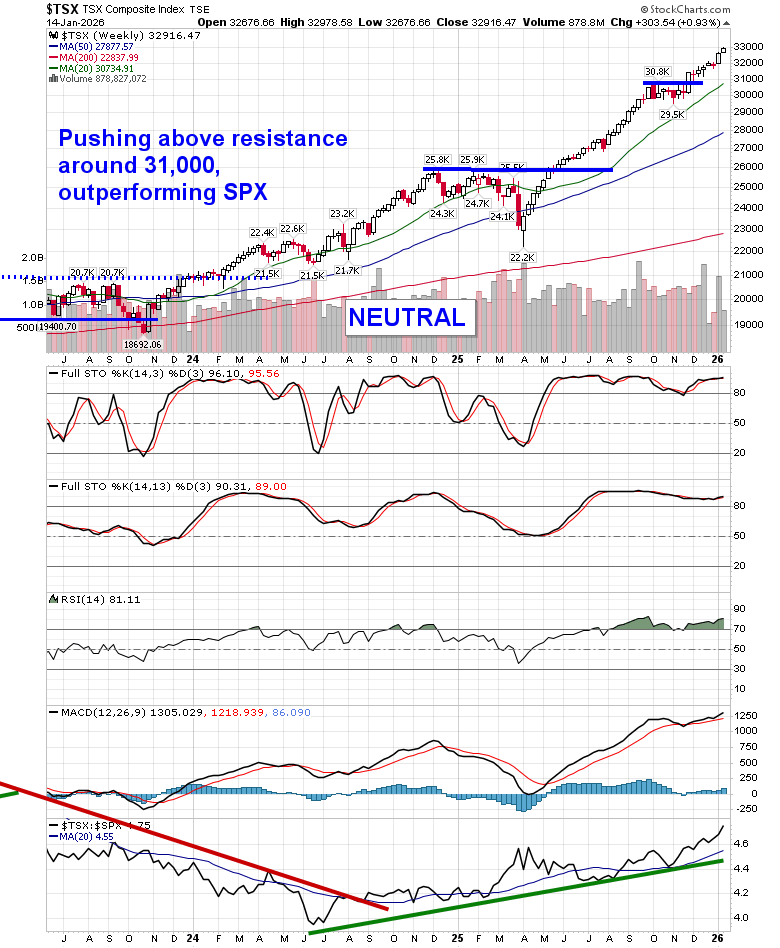
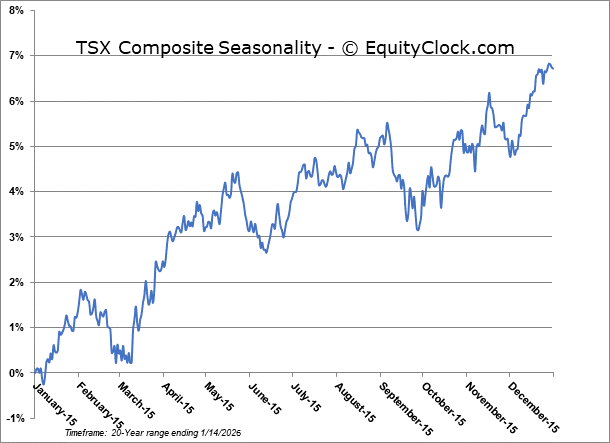
TSE Composite
| Sponsored By... |

|


