Stock Market Outlook for January 26, 2026

The weakest level for discretionary spending momentum in December raises concerns pertaining to the consumer, but the equity market remains on a pro-cyclical bent.
*** Stocks highlighted are for information purposes only and should not be considered as advice to purchase or to sell mentioned securities. As always, the use of technical and fundamental analysis is encouraged in order to fine tune entry and exit points to average seasonal trends.
Stocks Entering Period of Seasonal Strength Today:
Subscribers Click on the relevant link to view the full profile. Not a subscriber? Signup here.

First Trust Nasdaq Food & Beverage ETF (NASD:FTXG) Seasonal Chart

Alamos Gold Inc. (NYSE:AGI) Seasonal Chart

Western Union Co. (NYSE:WU) Seasonal Chart

Crane Co. (NYSE:CR) Seasonal Chart

Canadian Natural Resources Ltd. (TSE:CNQ.TO) Seasonal Chart

Greenbrier Cos, Inc. (NYSE:GBX) Seasonal Chart

United States 12 Month Oil Fund, LP (NYSE:USL) Seasonal Chart

CSX Corp. (NASD:CSX) Seasonal Chart

NextEra Energy Inc. (NYSE:NEE) Seasonal Chart

iShares U.S. High Dividend Equity Index ETF (CAD-Hedged) (TSE:XHD.TO) Seasonal Chart

ProShares S&P 500 Dividend Aristocrats ETF (NYSE:NOBL) Seasonal Chart

Invesco DWA Emerging Markets Momentum ETF (NASD:PIE) Seasonal Chart
Disclaimer: Comments and opinions offered in this report are for information only. They should not be considered as advice to purchase or to sell mentioned securities. Data offered is believed to be accurate, but is not guaranteed.
The Markets
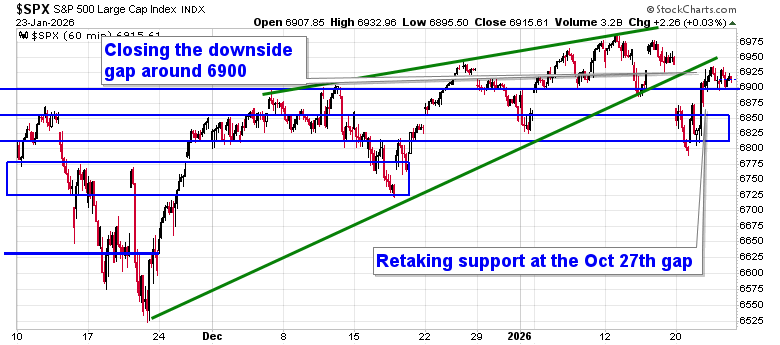
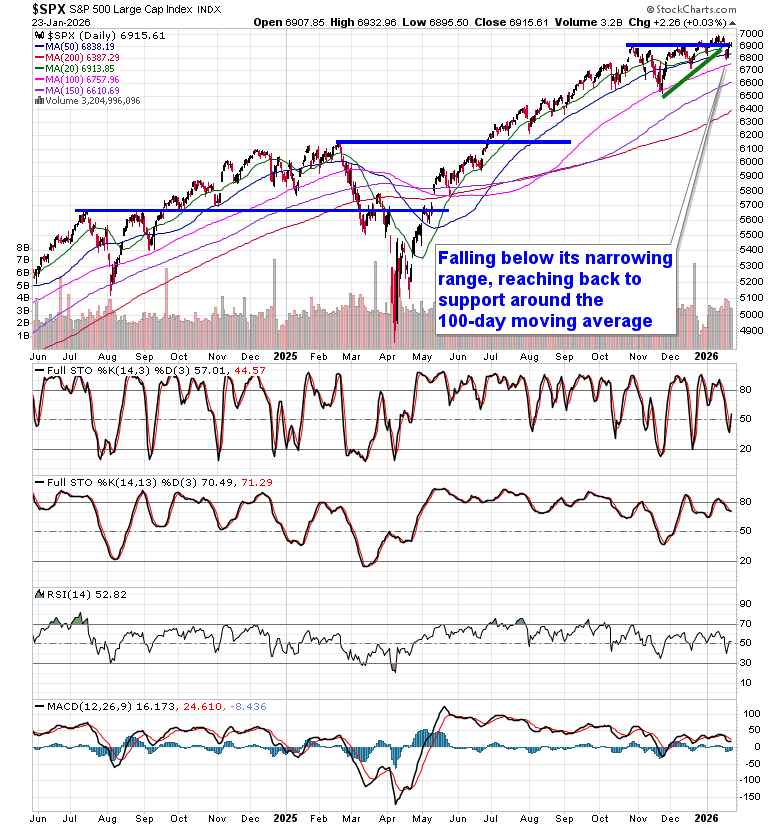
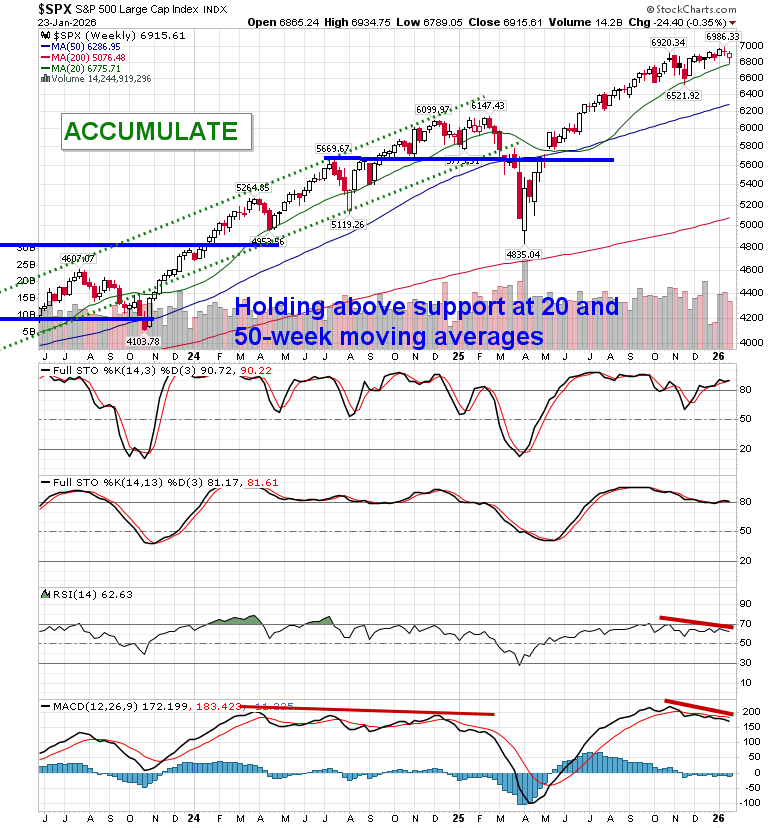
Stocks traded mixed on Friday as the market looks to move past the geopolitical turmoil that started the week. The S&P 500 Index ticked higher by a mere 0.03%, remaining within the gap that was opened at the start of the week around 6900. The benchmark is, once again, solidifying a position above previous October gap resistance turned support around 6830, keeping us engaged with equity exposure until definitively broken. The lower limit of the previous narrowing range that we have been profiling for the past month remains broken and is showing hints of imposing a point of resistance, along with the aforementioned downside gap at 6900. As highlighted in our recent reports, the triggers have been present to trim equity exposure, but we had little desire to participate in the panic selling that played out to start the week. Prior to Tuesday’s session, the market was showing greater respect to levels of support than to levels of resistance, but the price action this past week threatens to flip this stance; should this become confirmed, looking to trim equity exposure will become prudent, bracing for the kind of volatility that is average around this time of year. In the Seasonal Advantage Portfolio that we oversee at Castlemoore, after enacting trades in the prior week to reduce sensitivity to growth (Technology) segments of the market, there have been no trades that were considered to be required and we continue to benefit from our pro-cyclical stance. We continue to tailor towards the themes in our chart books to either Accumulate or Avoid that have been capturing the strength and rotation that has filtered into the market from the November 20th lows.
Today, in our Market Outlook to subscribers, we discuss the following:
- Market Action & Key Technical Levels
- Portfolio Positioning & Strategy
- Rotation & Mean Reversion
- Earnings Season & Seasonal Risks
- Weekly Technical Picture
- Sector Preferences & Themes
- Canadian Consumer Warning Signs
- Consumer Momentum & Discretionary Risk
Subscribers can look for this report in their inbox or by clicking on the following link and logging in: Market Outlook for January 26
Not signed up yet? Subscribe now to receive full access to all of the research and analysis that we publish
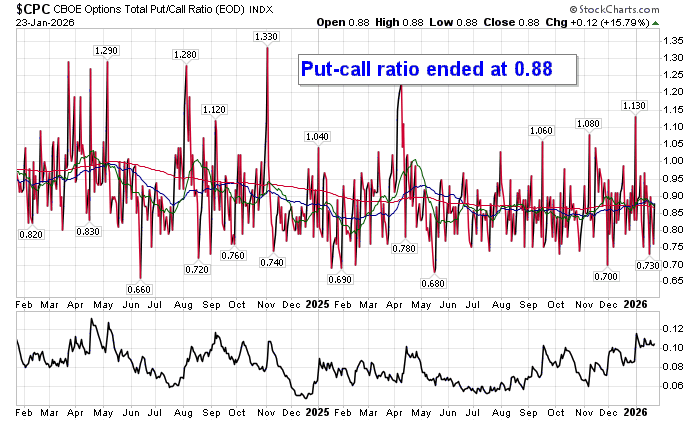
Sentiment on Friday, as gauged by the put-call ratio, ended bullish at 0.88.
Seasonal charts of companies reporting earnings today:


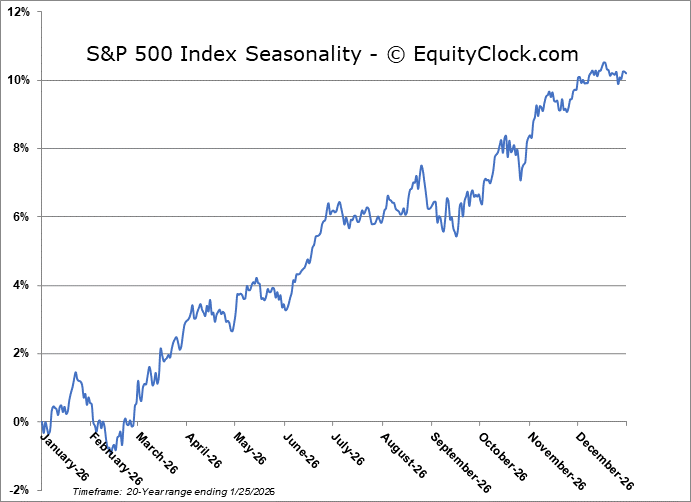
S&P 500 Index
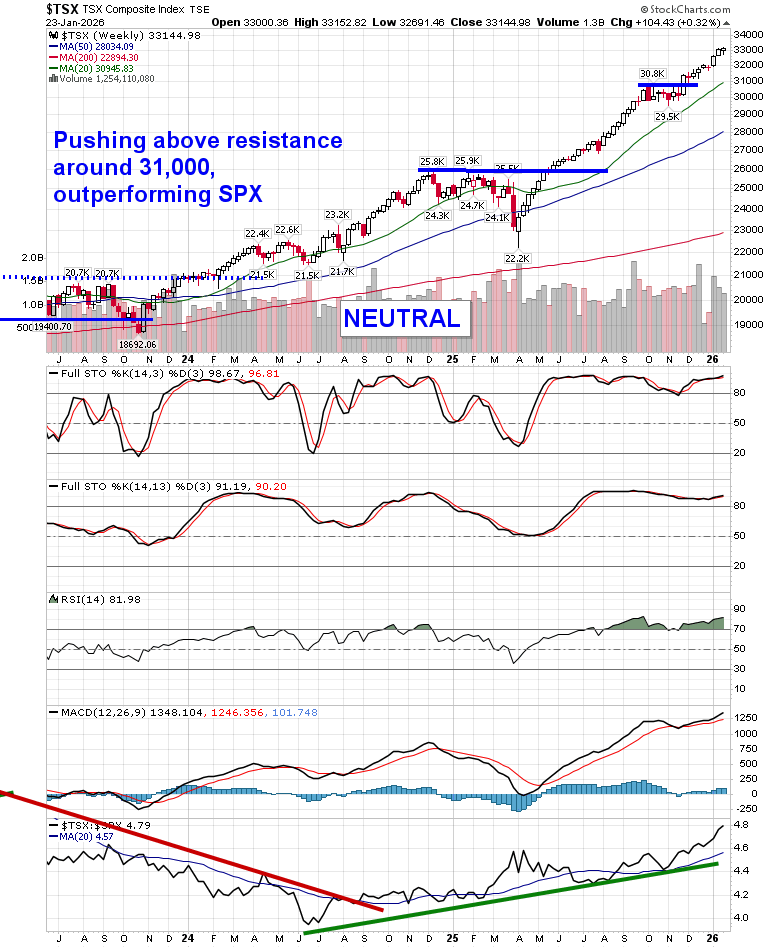
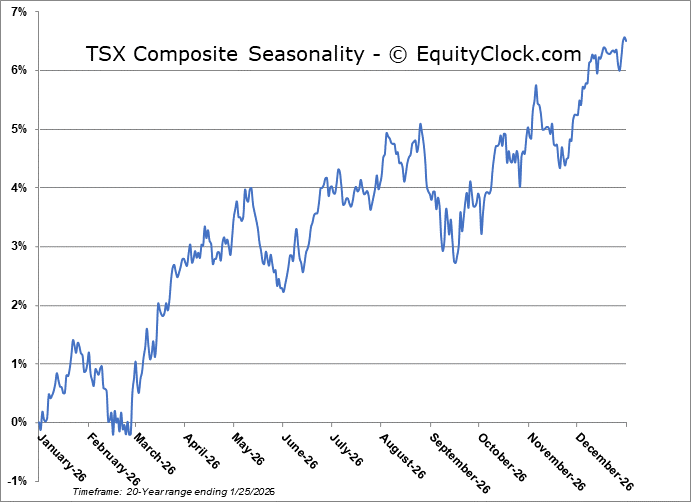
TSE Composite
| Sponsored By... |

|


