Stock Market Outlook for January 28, 2026

The US Dollar Index is breaking down. We’ll tell you where to focus portfolio exposure in this backdrop that is fairly normal for mid-term election years.
*** Stocks highlighted are for information purposes only and should not be considered as advice to purchase or to sell mentioned securities. As always, the use of technical and fundamental analysis is encouraged in order to fine tune entry and exit points to average seasonal trends.
Stocks Entering Period of Seasonal Strength Today:
Subscribers Click on the relevant link to view the full profile. Not a subscriber? Signup here.

CleanSpark, Inc. (NASD:CLSK) Seasonal Chart

ProShares VIX Mid-Term Futures ETF (AMEX:VIXM) Seasonal Chart

Ocugen Inc. (NASD:OCGN) Seasonal Chart
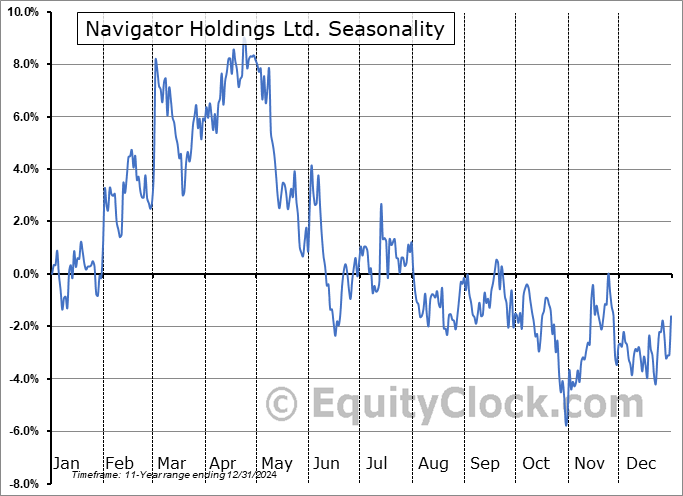
Navigator Holdings Ltd. (NYSE:NVGS) Seasonal Chart

Edison Intl, Inc. (NYSE:EIX) Seasonal Chart

Tronox Holdings plc (NYSE:TROX) Seasonal Chart

Westinghouse Air Brake Technologies Corporation (NYSE:WAB) Seasonal Chart

Hasbro, Inc. (NASD:HAS) Seasonal Chart
Disclaimer: Comments and opinions offered in this report are for information only. They should not be considered as advice to purchase or to sell mentioned securities. Data offered is believed to be accurate, but is not guaranteed.
Note to subscribers using Hotmail/MSN/Outlook emails: We have been receiving bounce-backs of our distributions to you in the past couple of days. We have escalated the matter to our deliverability team and hope to have a resolution soon. We apologize for the disruption that has resulted.
The Markets
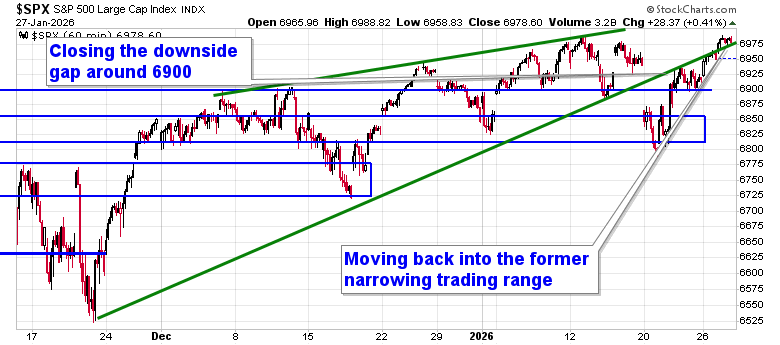
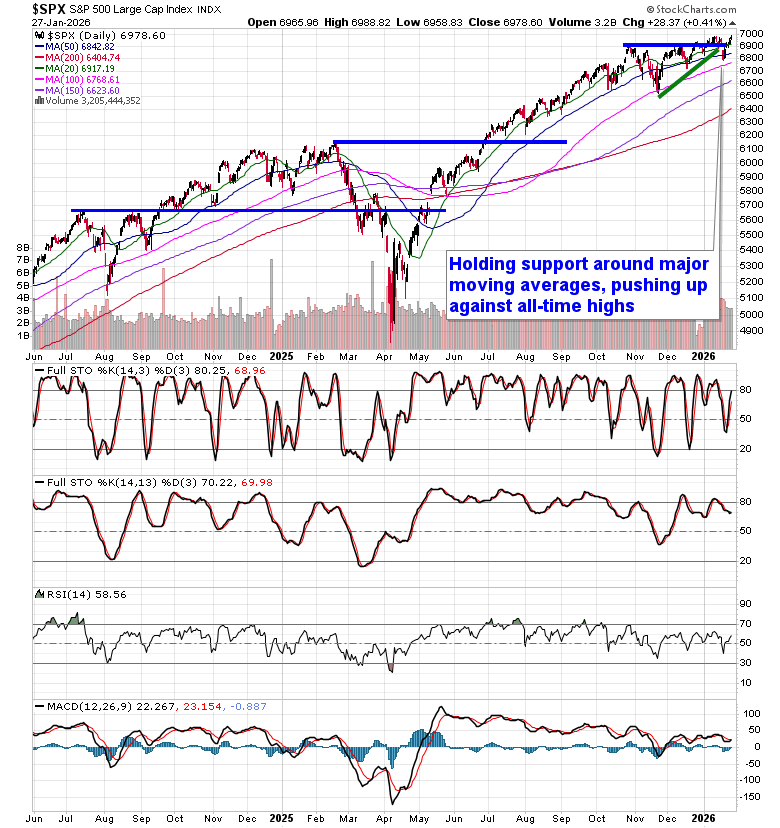
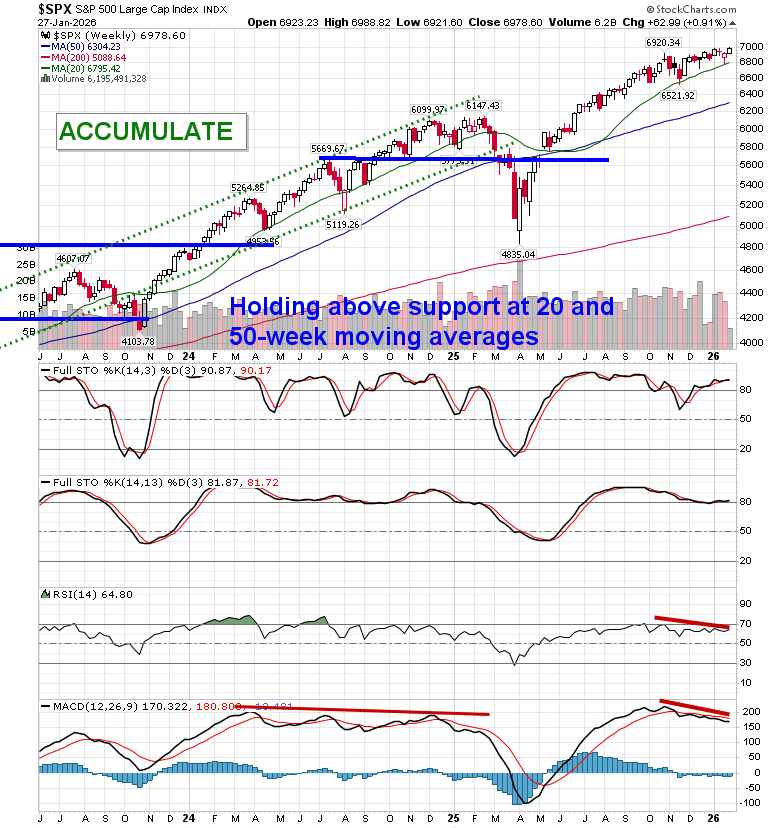
Investors continue to shake off concerns pertaining to the threat of another government shutdown in the US and geopolitical uncertainty, instead paring negative bets and positioning for the onslaught of technology earnings in the days ahead. The S&P 500 Index added just over four-tenths of one percent, led by Technology, charting a fresh all-time intraday high during the session. The record closing highs around 6980 is being tested as resistance as the benchmark moves past some recent levels (eg. January 20th downside gap around 6900) that threatened to cap the advance in its push towards the major psychological threshold around 7000. Previous October gap resistance turned support around 6830 has been keeping us engaged with equity exposure until definitively broken. We remain on the lookout for a potential shift of the market’s character ahead where levels of resistance hold greater weight than support, but, despite the threats, nothing has been revealed yet; should this become confirmed, looking to trim equity exposure will become prudent, bracing for the kind of volatility that is average around this time of year. In the Seasonal Advantage Portfolio that we oversee at Castlemoore, there have been no trades that have been considered to be required and we continue to benefit from our pro-cyclical stance. We continue to tailor towards the themes in our chart books to either Accumulate or Avoid that have been capturing the strength and rotation that has filtered into the market from the November 20th lows.
Today, in our Market Outlook to subscribers, we discuss the following:
- Market Action & Technical Backdrop
- Economic Data: Manufacturing & AI Tailwinds
- Caterpillar (CAT): Bellwether Signal
- Emerging Markets: Leadership Confirmed
- US Dollar Weakness & Commodity Tailwinds
- Yen Strength & “Sell America” Risk
- Home Prices: Growing Recession Signal
Subscribers can look for this report in their inbox or by clicking on the following link and logging in: Market Outlook for January 28
Not signed up yet? Subscribe now to receive full access to all of the research and analysis that we publish
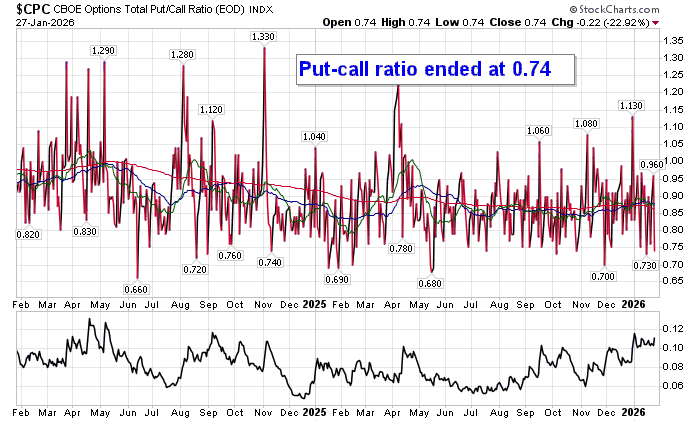
Investor sentiment on Tuesday, as gauged by the put-call ratio, ended bullish at 0.74.
Seasonal charts of companies reporting earnings today:


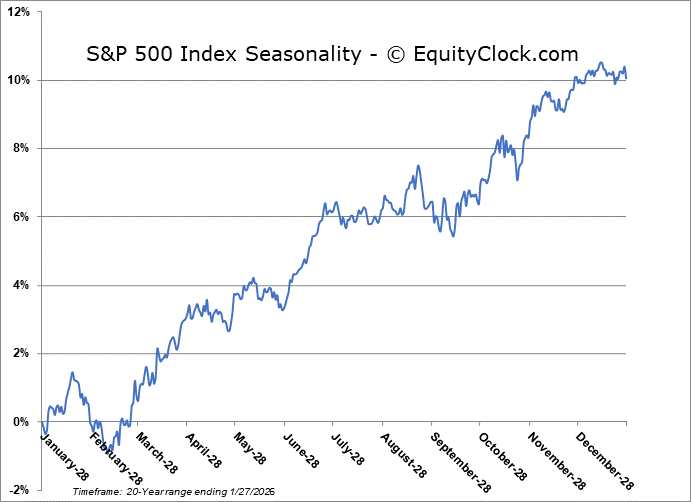
S&P 500 Index
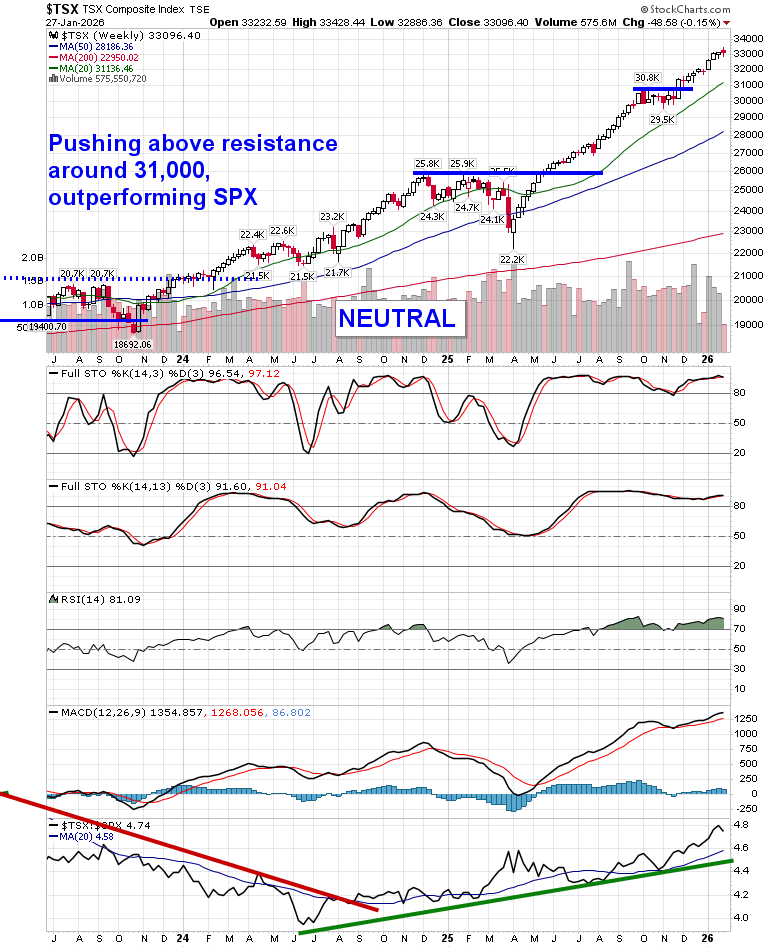
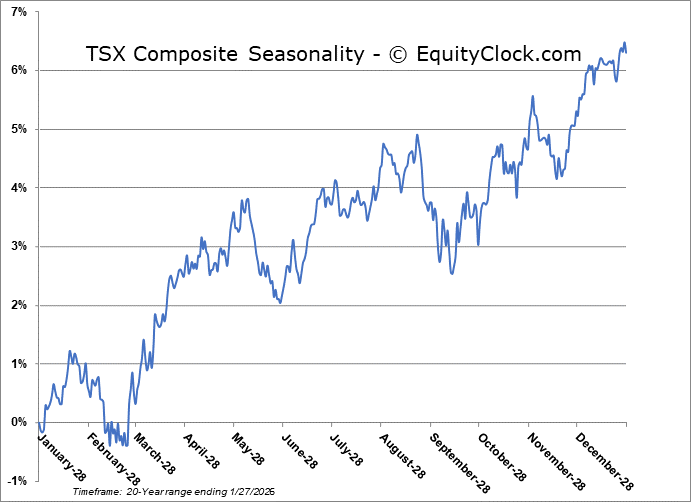
TSE Composite
| Sponsored By... |

|


