Stock Market Outlook for February 3, 2026

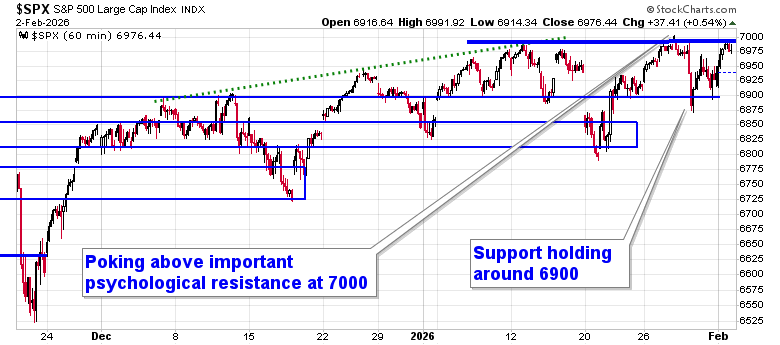
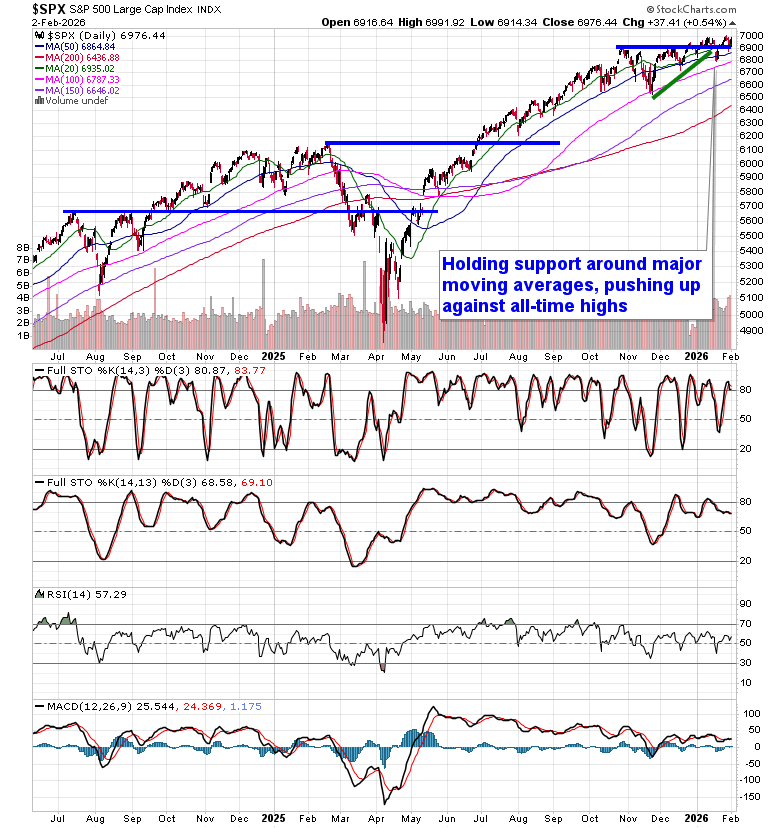
The trading/consolidation range on the S&P 500 Index just below 7000 is providing a good likelihood of an upside breakout.
*** Stocks highlighted are for information purposes only and should not be considered as advice to purchase or to sell mentioned securities. As always, the use of technical and fundamental analysis is encouraged in order to fine tune entry and exit points to average seasonal trends.
Stocks Entering Period of Seasonal Strength Today:
Subscribers Click on the relevant link to view the full profile. Not a subscriber? Signup here.

Atco Ltd. (TSE:ACO/X.TO) Seasonal Chart

VanEck Environmental Services ETF (NYSE:EVX) Seasonal Chart
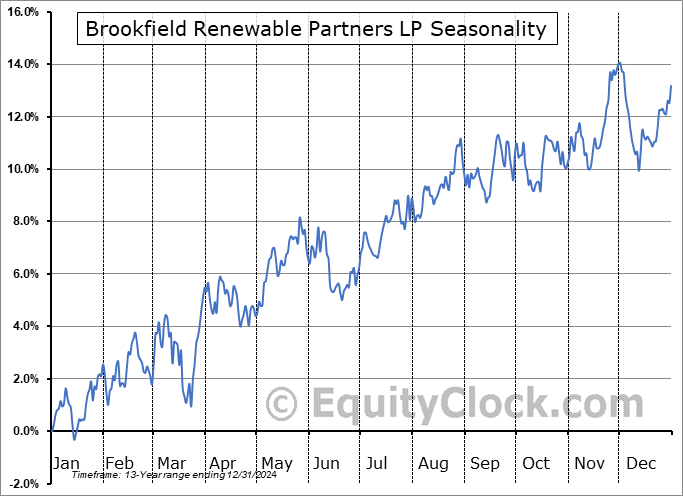
Brookfield Renewable Partners LP (NYSE:BEP) Seasonal Chart
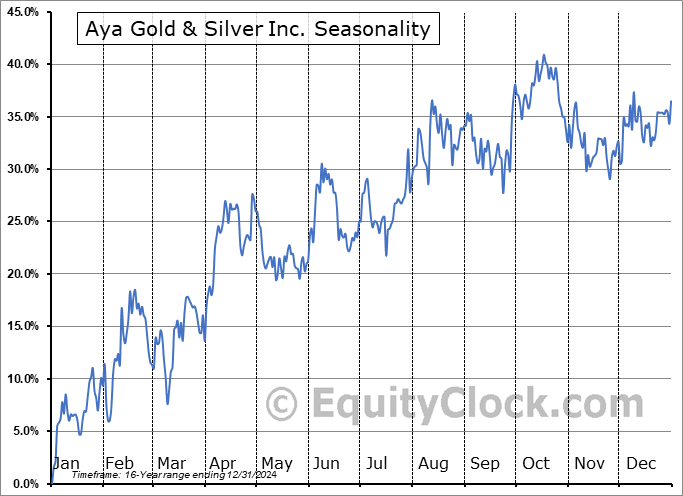
Aya Gold & Silver Inc. (TSE:AYA.TO) Seasonal Chart
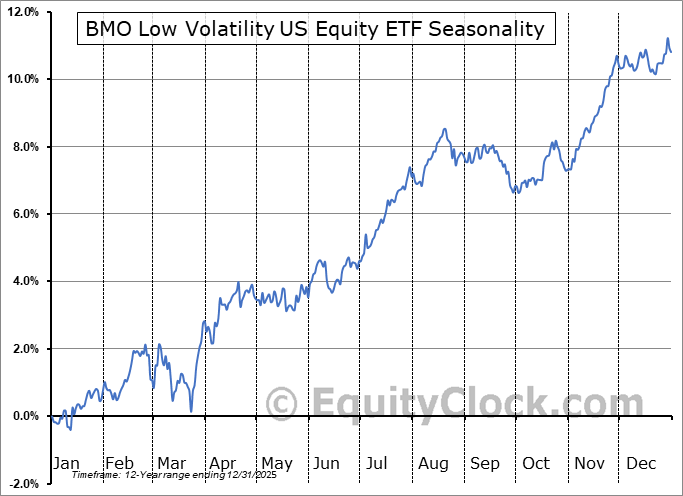
BMO Low Volatility US Equity ETF (TSE:ZLU/U.TO) Seasonal Chart
Disclaimer: Comments and opinions offered in this report are for information only. They should not be considered as advice to purchase or to sell mentioned securities. Data offered is believed to be accurate, but is not guaranteed.
The Markets
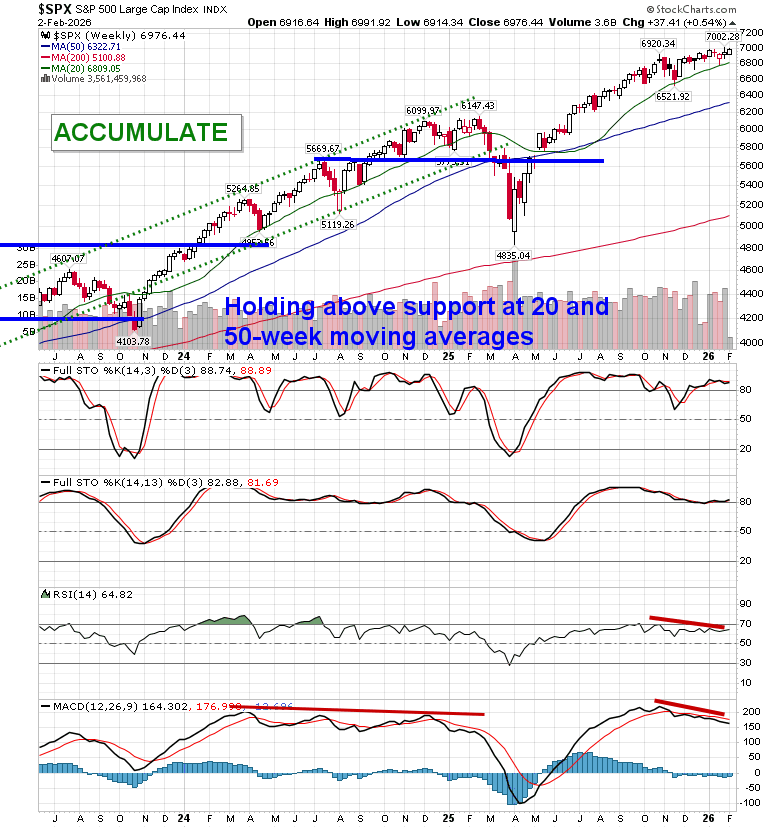
Stocks shook off a sharp drop in the value of cryptocurrencies over the weekend and follow-through to Friday’s slide in precious metal prices to trade higher at the start of the new month. The S&P 500 Index closed up by just over half of one percent, reaching back towards important psychological resistance at 7,000. Short-term support around 6900 remains intact, defining a trading range between this and the aforementioned all-time peak. At this point, an upside resolution seems more probable than not. Previous October gap resistance turned support around 6830 has been keeping us engaged with equity exposure until definitively broken. We remain on the lookout for a potential shift of the market’s character ahead where levels of resistance hold greater weight than support and, while the very recent price action has provided hints of this, nothing definitive has been revealed yet to shake us loose of our equity exposure; should a topping pattern become confirmed, looking to trim equity exposure will become prudent, bracing for the kind of volatility that is average around this time of year. In the Seasonal Advantage Portfolio that we manage for clients at CastleMoore, there have been no trades that have been considered to be required and we continue to benefit from our pro-cyclical and commodity oriented stance (many of which were positive last week, overall). We continue to tailor towards the themes in our chart books to either Accumulate or Avoid that have been capturing the strength and rotation that has filtered into the market from the November 20th lows.
Want to know which areas of the market to buy or sell? Our Weekly Chart Books have just been updated, providing a clear Accumulate, Avoid, or Neutral rating for currencies, cryptocurrencies, commodities, broad markets, and subsectors/industries of the market. Subscribers can login and click on the relevant links to access.
- Currencies
- Cryptocurrencies
- Commodities
- Major Benchmarks
- Sub-sectors / Industries
- ETFs: Bonds | Commodities | Equity Markets | Industries | Sectors
Subscribe now.
Today, in our Market Outlook to subscribers, we discuss the following:
- Market Action & Technical Setup
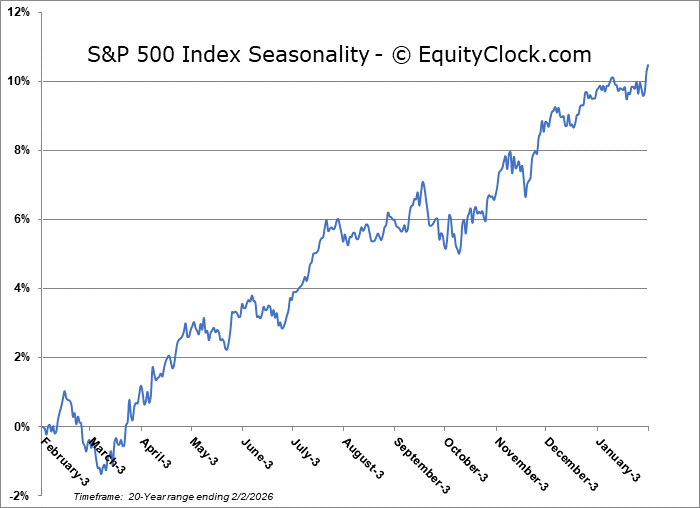
- Seasonality, Volatility & Market Character
- Strategic Outlook
- Our Weekly Chart Books update, along with the list of all segments of the market to either Accumulate or Avoid
- Defensive Shift: Food Products Upgrade
- Downgrades: Consumer Discretionary Pressure
- Canada Small Caps/Precious Metal Mining: Taking Profits
- Other Notes pertaining to broader market dynamics and focus for the week(s) ahead
Subscribers can look for this report in their inbox or by clicking on the following link and logging in: Market Outlook for February 3
Not signed up yet? Subscribe now to receive full access to all of the research and analysis that we publish
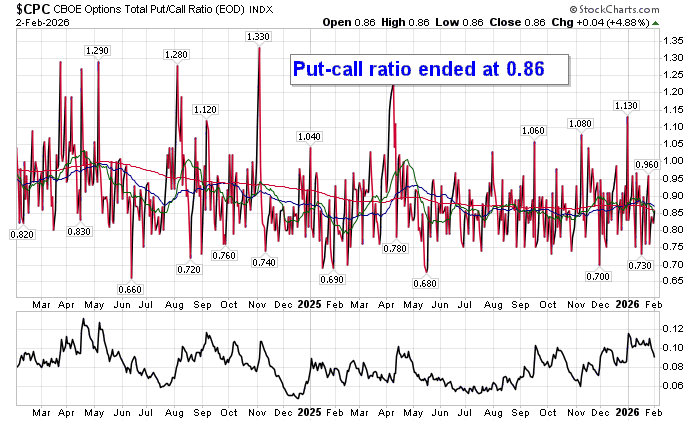
Sentiment on Monday, as gauged by the put-call ratio, ended bullish at 0.86.
Seasonal charts of companies reporting earnings today:


S&P 500 Index
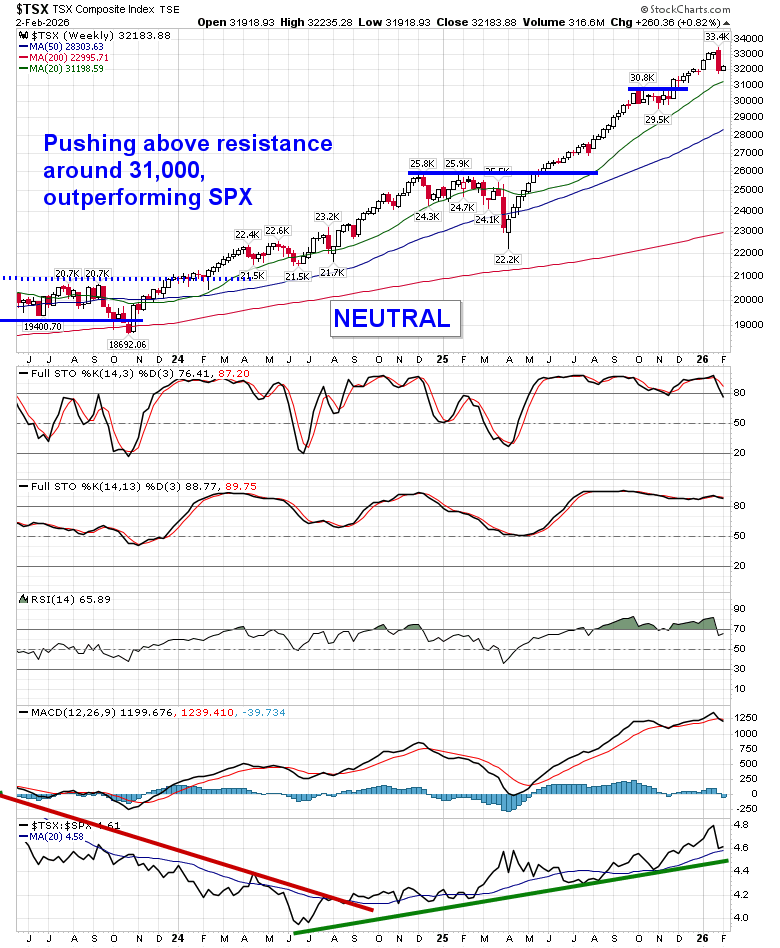
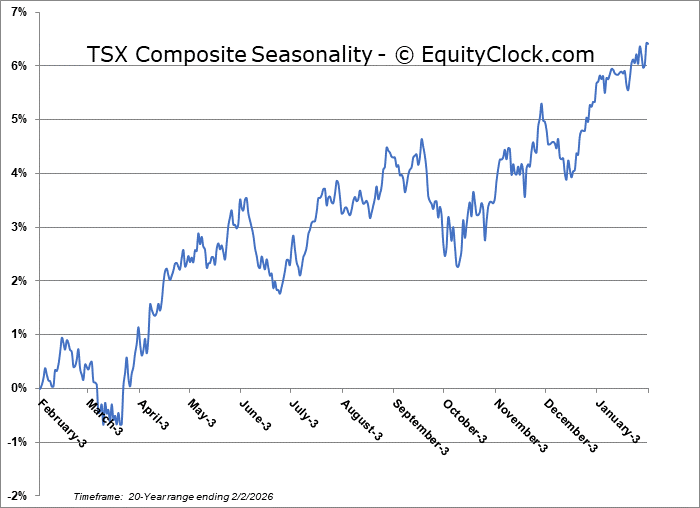
TSE Composite
| Sponsored By... |

|


