Stock Market Outlook for February 5, 2026

Energy fundamentals increasingly favouring a bullish bias of the stocks and the commodities heading towards the spring.
*** Stocks highlighted are for information purposes only and should not be considered as advice to purchase or to sell mentioned securities. As always, the use of technical and fundamental analysis is encouraged in order to fine tune entry and exit points to average seasonal trends.
Stocks Entering Period of Seasonal Strength Today:
Subscribers Click on the relevant link to view the full profile. Not a subscriber? Signup here.

BorgWarner, Inc. (NYSE:BWA) Seasonal Chart

Credicorp Ltd. (NYSE:BAP) Seasonal Chart

Nordic American Tankers Limited (NYSE:NAT) Seasonal Chart

Invesco Dynamic Food & Beverage ETF (NYSE:PBJ) Seasonal Chart
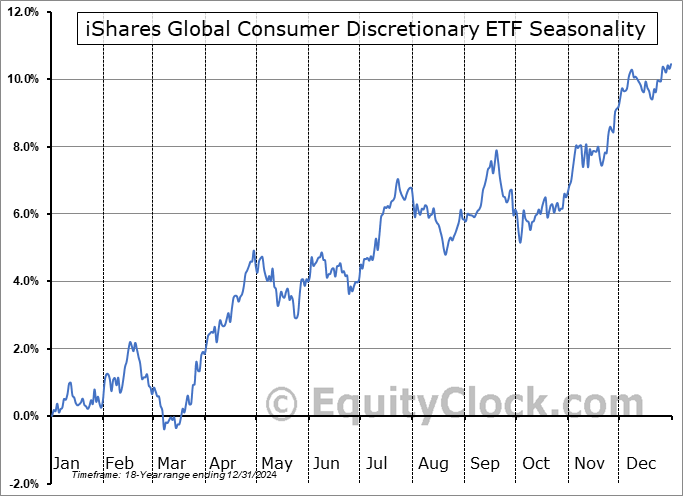
iShares Global Consumer Discretionary ETF (NYSE:RXI) Seasonal Chart

SEACOR Marine Holdings Inc. (NYSE:SMHI) Seasonal Chart
Disclaimer: Comments and opinions offered in this report are for information only. They should not be considered as advice to purchase or to sell mentioned securities. Data offered is believed to be accurate, but is not guaranteed.
The Markets
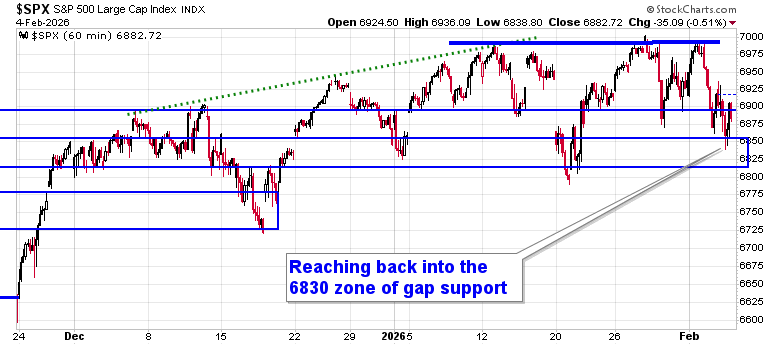
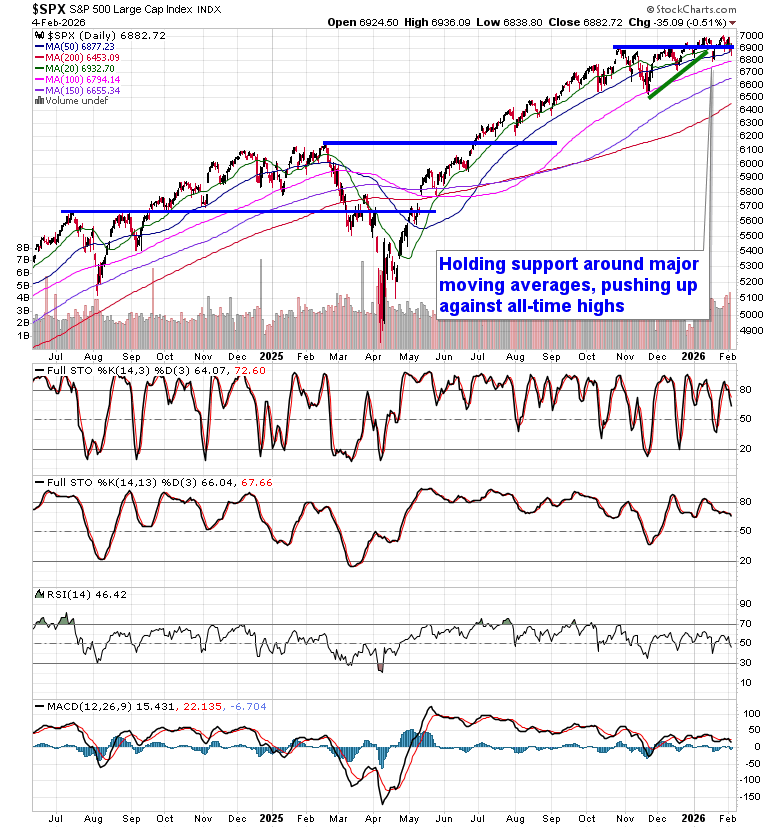
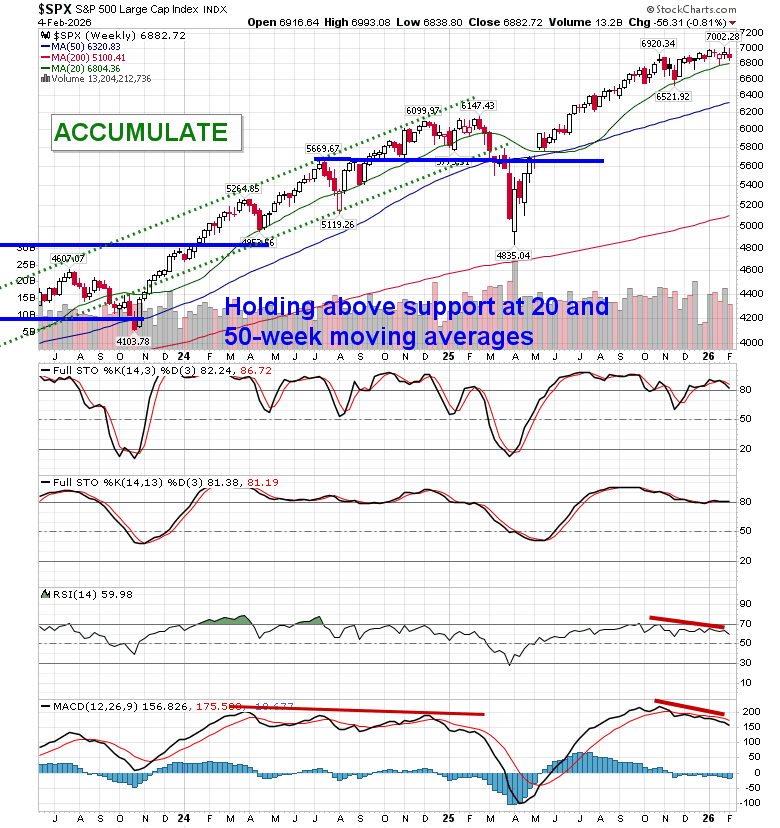
Selling pressures in the market spilled into the Wednesday session as ongoing weakness in Bitcoin and the rotation out of technology continue to take a toll on broad market benchmarks. The S&P 500 Index closed lower by just over half of one percent, once again intersecting with short-term support around 6900. The 100-point trading range that we have highlighted in recent days between 6900 and 7000 is showing cracks and previous October gap resistance turned support around 6830 is attempting to keep the benchmark afloat; until definitively broken, elevated equity exposure in portfolios remains justified. Upside momentum in this technology influenced benchmark has become lacklustre and the risks are rising that we observe the type of weakness/digestion in the broader market that is quite normal at this time of year during mid-term election periods. We remain on the lookout for a potential shift of the market’s character ahead where levels of resistance hold greater weight than support and, while the very recent price action has provided hints of this, nothing definitive has been revealed yet to shake us loose of our equity exposure; should a topping pattern become confirmed, looking to trim equity exposure will become prudent, bracing for the kind of volatility that is average around this time of year. In the Seasonal Advantage Portfolio that we manage for clients at CastleMoore, we are looking at some trades ahead to align with the risks that are creeping into the market ahead of the average mid-February peak in stocks, but, for now, we continue to benefit from our pro-cyclical and commodity oriented stance. We continue to tailor towards the themes in our chart books to either Accumulate or Avoid that have been capturing the strength and rotation that has filtered into the market from the November 20th lows.
Today, in our Market Outlook to subscribers, we discuss the following:
- Market Pressure & Key Technical Levels
- Portfolio Strategy & Positioning
- Technology Breakdown & Growth Headwinds
- Software vs. Semiconductors: A Tactical Setup
- Rotation, Not Risk Abandonment
- Energy: Clear Leadership & Alpha Driver
- Oil Fundamentals Strengthen the Case
- Energy Allocations Delivering Alpha
Subscribers can look for this report in their inbox or by clicking on the following link and logging in: Market Outlook for February 5
Not signed up yet? Subscribe now to receive full access to all of the research and analysis that we publish
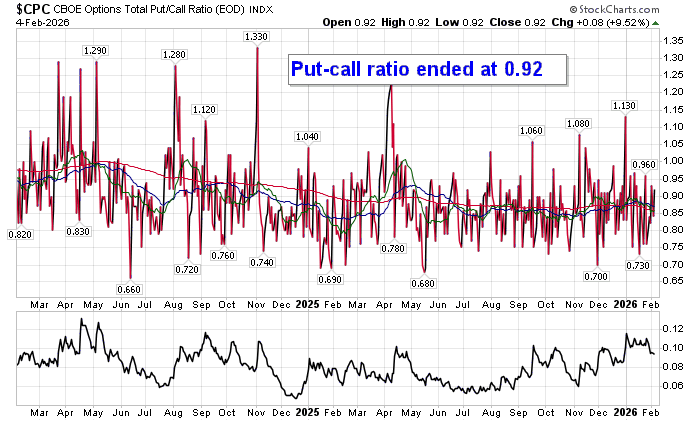
Sentiment on Wednesday, as gauged by the put-call ratio, ended slightly bullish at 0.92.
Seasonal charts of companies reporting earnings today:


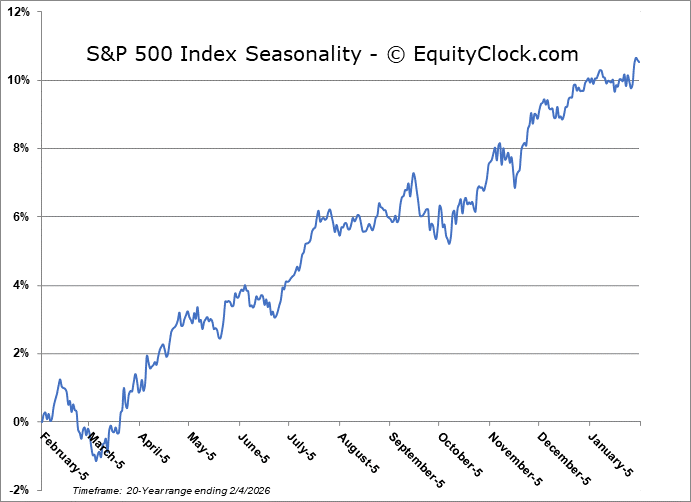
S&P 500 Index
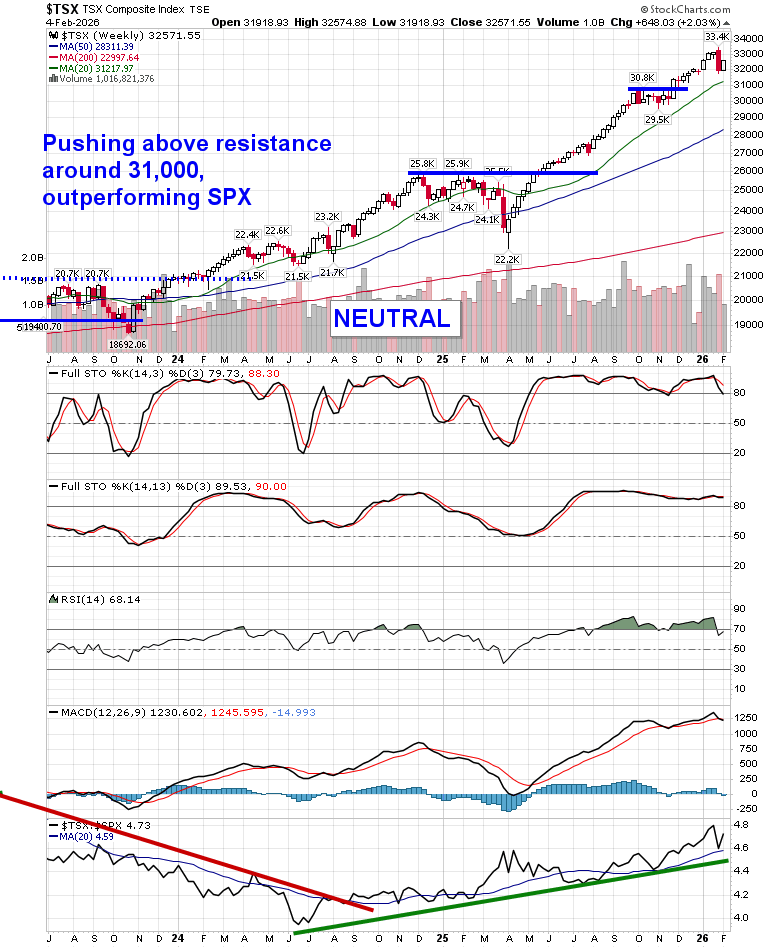
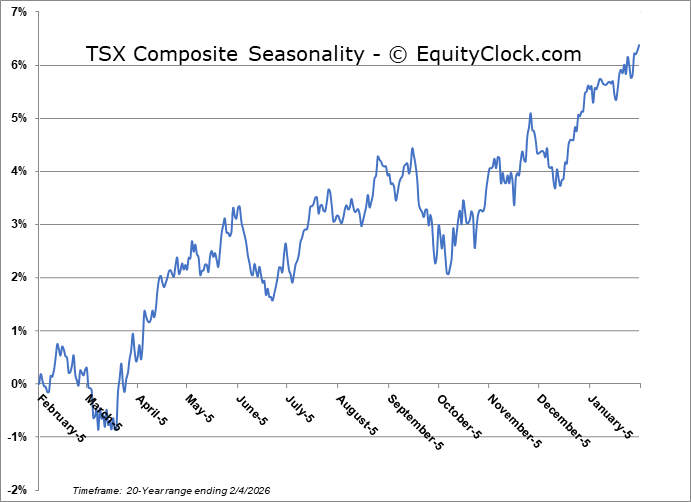
TSE Composite
| Sponsored By... |

|


